Next Stop 52K or 75K for BTC? Here's The Full Breakdown With Probabilities
/The 52k vs 75k Model - A Map Through The Chop Zone!
The big fat question on my mind right now is this: Is BTC about to drop to 52k for the Bear Market Bottom, or are we about to rally to 75K and build from there? This is a seriously difficult question to answer from the evidence we have on the charts, and from considering economic developments plus world events. But we do know that this is a pivot point
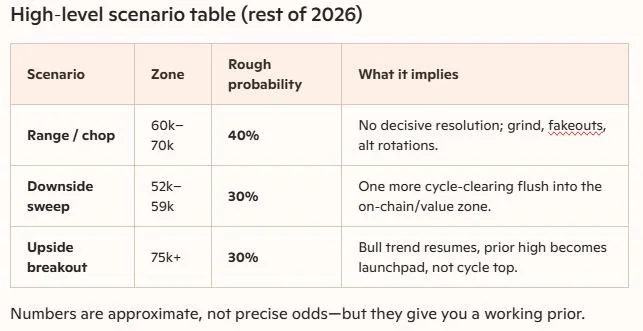
Here’s how I’m framing it. We’ll call it the “52k vs 75k Model”, given where BTC is sitting now. So let’s start out with a table that presents 3 scenarios, and lay out the probability of each one side by side.
One thing we need to discuss is exactly why 52k BTC is even part of this discussion. Where am I getting that number from? And where is the 75k bullish target coming from? Let’s give you the facts on the range that I’ve presented for the model.
Why 52k Is On The Map
Technical cluster: Multiple models and TA desks are flagging a 52k–59k “bottom zone” based on prior structure and on‑chain valuation bands. [^1][^2]
Structure: From the 120k high you’ve got a clear series of lower highs/lows on mid‑timeframes; a proper “cycle wash” often tags a deeper support pocket before a true secular leg resumes.
Macro risk: Any risk‑off shock (rates, liquidity, ETF outflows, regulatory hit) can easily push BTC from mid‑60s into that 52–59 pocket without breaking the long‑term adoption story. [^3][^2]
So 52k is not a random doomsday level—it’s a structurally coherent “max pain but still bull‑market” downside.
Why 75k Is Also Very Real
Macro still constructive: BTC is holding above key long‑term MAs and is broadly treated as an institutional asset now; that tends to compress true bear phases and favor extended, messy bull trends over clean 4‑year boom/bust. [^4][^2]
Resistance ladder: Monthly/weekly pivots put meaningful resistance in the 70–80k band, with a key pivot region around mid‑70s. A sustained reclaim and hold above current mid‑60s resistance opens that 75k test. [^2]
Cycle character: This cycle has already shown “multi‑top” behavior (big run, deep correction, then another leg). That’s compatible with your “still in a bull, not classic 4‑year bear” idea—especially in a world of ETFs and corporate balance‑sheet flows. [^5][^2]
So 75k is the natural upside magnet if BTC proves that the 60k floor is real support, not a ledge.
How I’m Actually Using This Model
Now I’m going to lay out exactly what my game plan is, based on the 52k vs 75k model, and tell you how it will shape my trading strategy. This is what will guide me through the frustrating “side-banding” time period where we have nothing but boring BTC chop with no major breakouts.
1. Treat 52k as a tail‑risk buy zone, not base case.
You don’t build a plan assuming we have to see 52k—but you absolutely can pre‑plan what you’d do if BTC does drop down to that level so you’re not paralyzed or depressed if we see Bitcoin drop that far.
2. Treat 75k as the “trend confirmation” zone, not just a target.
The important thing isn’t tagging 75k once—it’s how we trade around 70–75k:
Strong weekly closes above 70k with rising volume and healthy funding → supports “ongoing bull, October was not the final top”.
Rejection w/ blow‑off behavior and heavy distribution → supports “October was the cycle high, this is a right‑shoulder / echo rally”.
3. Operate inside the 60–70k band as a “probabilistic fog zone”.
That’s where we are now: signals are mixed, macro is not screaming either way, and both 52k and 75k are live possibilities. Within that band, I’d:
Keep directional conviction low, risk per trade modest.
Let alts and micro‑setups (like DEGEN) be framed as tactical drifts rather than “cycle bets”.
Update the 52k vs 75k odds based on:
Weekly closes vs 64–66k resistance. [^1][^2]
ETF flows / macro liquidity tone. [^5][^3]
Direct Answer to the Core Question
Is 52k still on the table? Yes—roughly one‑third probability in my book, and it would likely be a fast event, not a slow bleed.
Is 75k this year plausible? Also yes—similar probability, contingent on a clean reclaim and hold above the mid‑60s resistance band and a cooperative macro tape.
Are we in a true bear market? Structurally, no. We’re in a high‑volatility, mid‑cycle digestion after a huge leg, with both a deeper flush and a renewed breakout still live.
We’ll keep our eyes on this closely, and once I have a firm grip (opinion) on the actual day that the “chop zone” ends, I will be sounding the alarm!
Carlton Flowers
The CryptoPro
References (5)
[^1]: Bitcoin Faces $64K–$66K Test as $52K Support Emerges. https://coinedition.com/bitcoin-faces-key-64k-66k-resistance-as-52k-support-comes-into-focus/
[^2]: Bitcoin Price Forecast 2026: Support Levels, Crash Analysis & Recovery. https://stealthex.io/blog/bitcoin-price-forecast-support-recovery/
[^3]: Bitcoin Price Prediction for June 2026: Institutional Exodus .... https://beincrypto.com/bitcoin-price-prediction-june-2026/
[^4]: Bitcoin (BTC) Price Prediction: Daily, Weekly 2026 - 2040. https://blog.coindcx.com/blog/price-predictions/bitcoin-price-weekly/
[^5]: Bitcoin Price Prediction June 2026: BTC Q2 Monthly Forecast. https://xgram.io/blog/bitcoin-price-prediction-june-2026-btc-q2-monthly-forecast