Why I'm Not Worried About OMI Over The Long Term
/OMI TECHNICAL ANALYSIS FOR MARCH 2022
Here is the chart featured in the video technical analysis of the OMI token. One thing I forgot to explain in the video is why I don’t trust the On-Balance Volume (OBV) line.
Usually, I look for the OBV line to be on the increase, which is an indication of overall accumulation going on by major investors.
But as you see on the OMI chart, the OBV line is decreasing over time, which usually indicates “distribution”, or selling off. The reason why I don’t trust the OBV line on this chart is due to the fact that it simply reflects the price action. When I see this on charts, it’s a tip-off that the approximation of overall accumulation or distribution is not accurate.
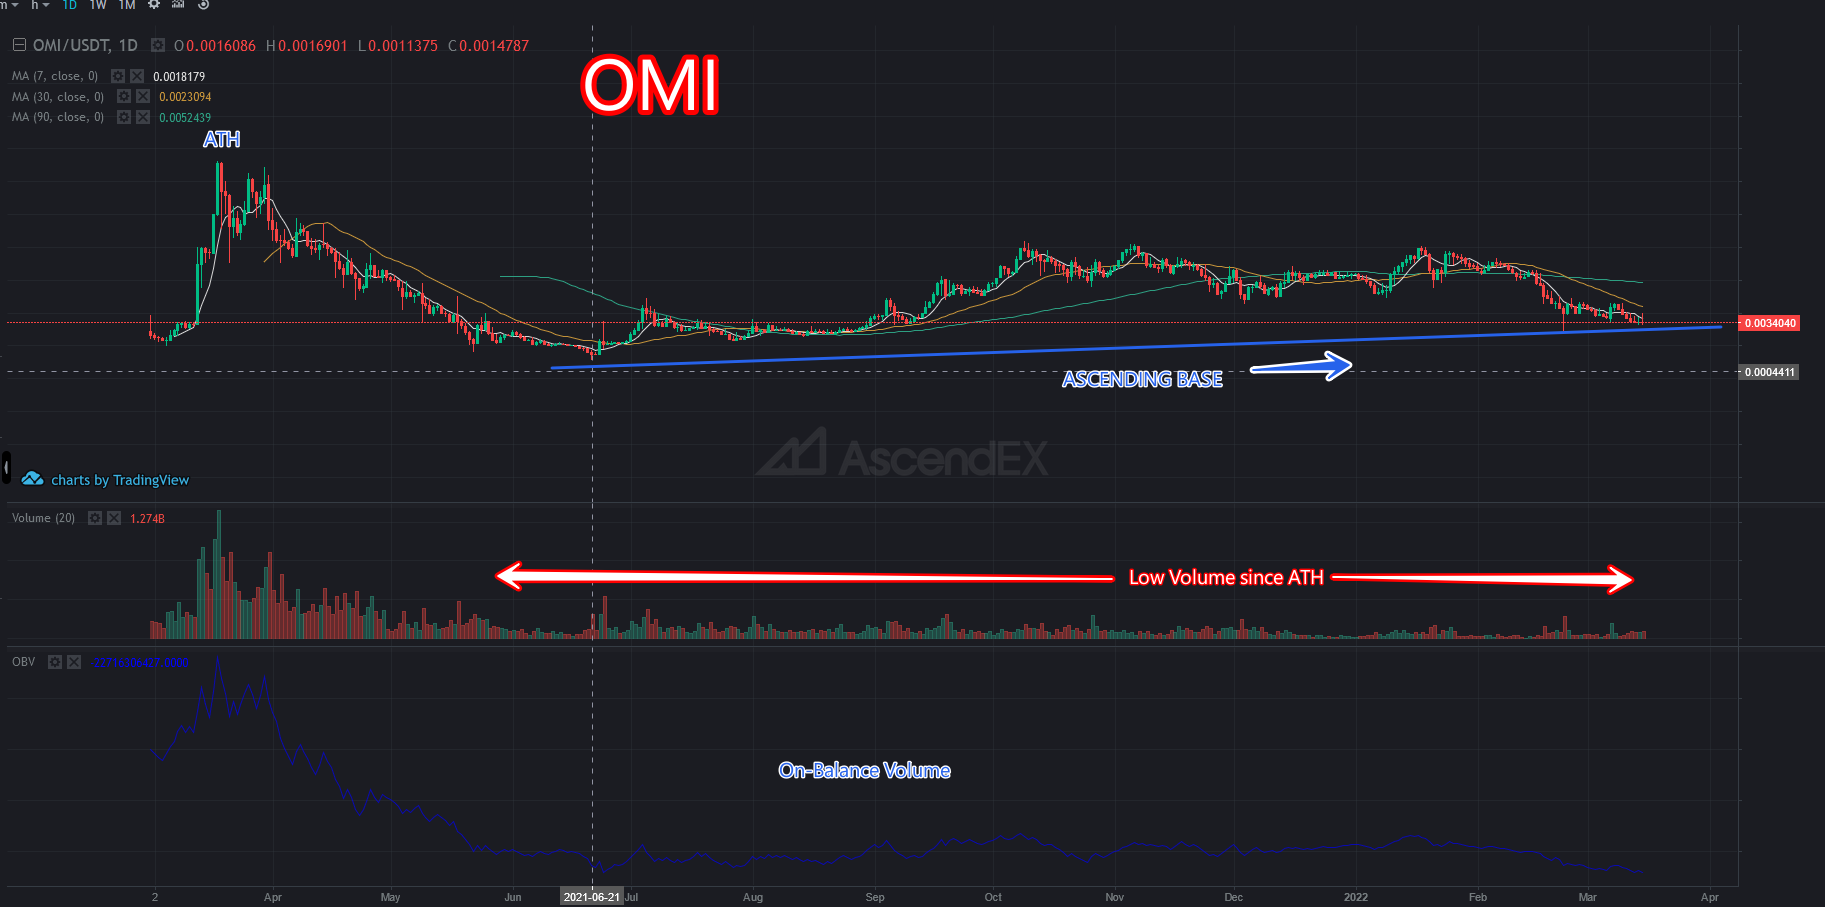
OMI 1-day Candlestick Chart
Take the OBV line on this chart as a grain of salt. But the overall price line and inclining base lets us know that there is confidence in the long term viability of the VeVe/Ecomi project. Something else I forgot to mention in the video is the fact that the volume has been relatively low since the run to 0.013 in 2021, but the base line has continued to creep upwards. This is a definite sign of overall strength.
Stay tuned for more updates on the OMI price movement, and post your comments below!
Carlton Flowers
The CryptoPro