Strong Bitcoin Correction - 2 Reasons Why, Plus Technical Analysis for 9-3-2020

TWO KEY EVENTS THAT INFLUENCE THE BTC CHART

While Bitcoin is in the midst of a strong correction, there are two other events happening which I believe have a direction influence. What are they?

1) The stock market dumping

2) The US Dollar rallying (DXY)

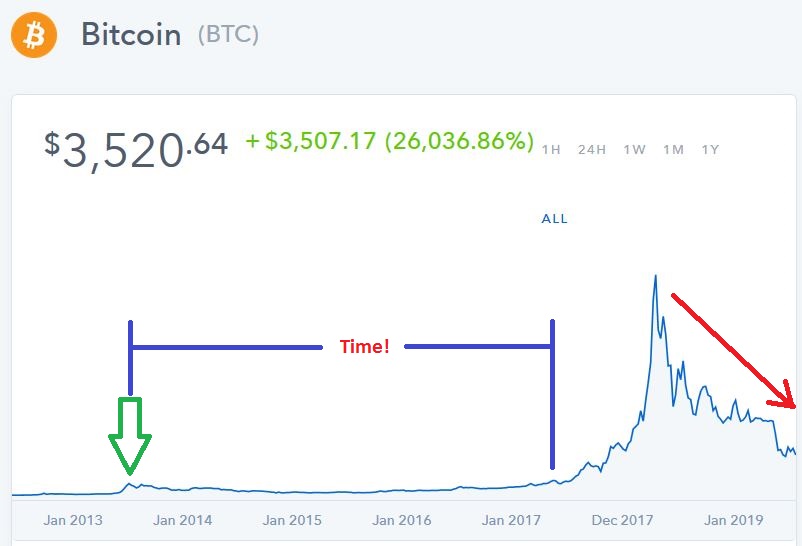
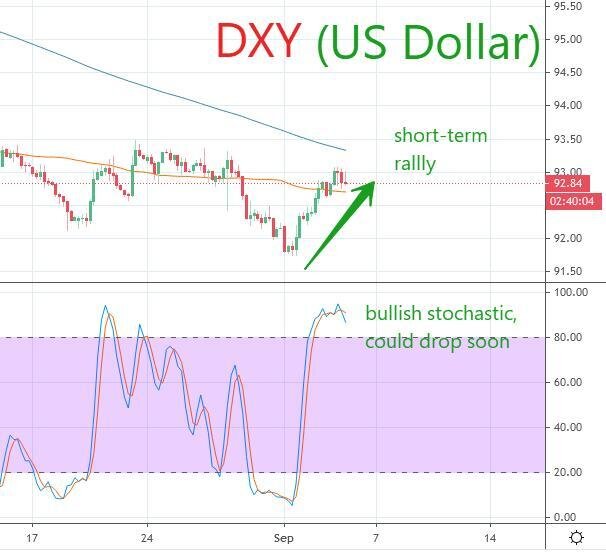
In history, we have observed that Bitcoin has a tendency to move in the opposite direction of a rallying US Dollar. Looking at the DXY chart, we have seen a short-term rally taking place over the past several days that coincides directly with the Bitcoin correction.

If you add in a stock market dump, and you have a resulting strong BTC correction. Take note that the Dow Jones Industrial Average got dangerously close to the previous high, before a harsh selloff ensued.

But let’s shift the focus to the Bitcoin chart provided by TradingView, and see if we can gather some clues as to what will happen next with this sizeable correction.

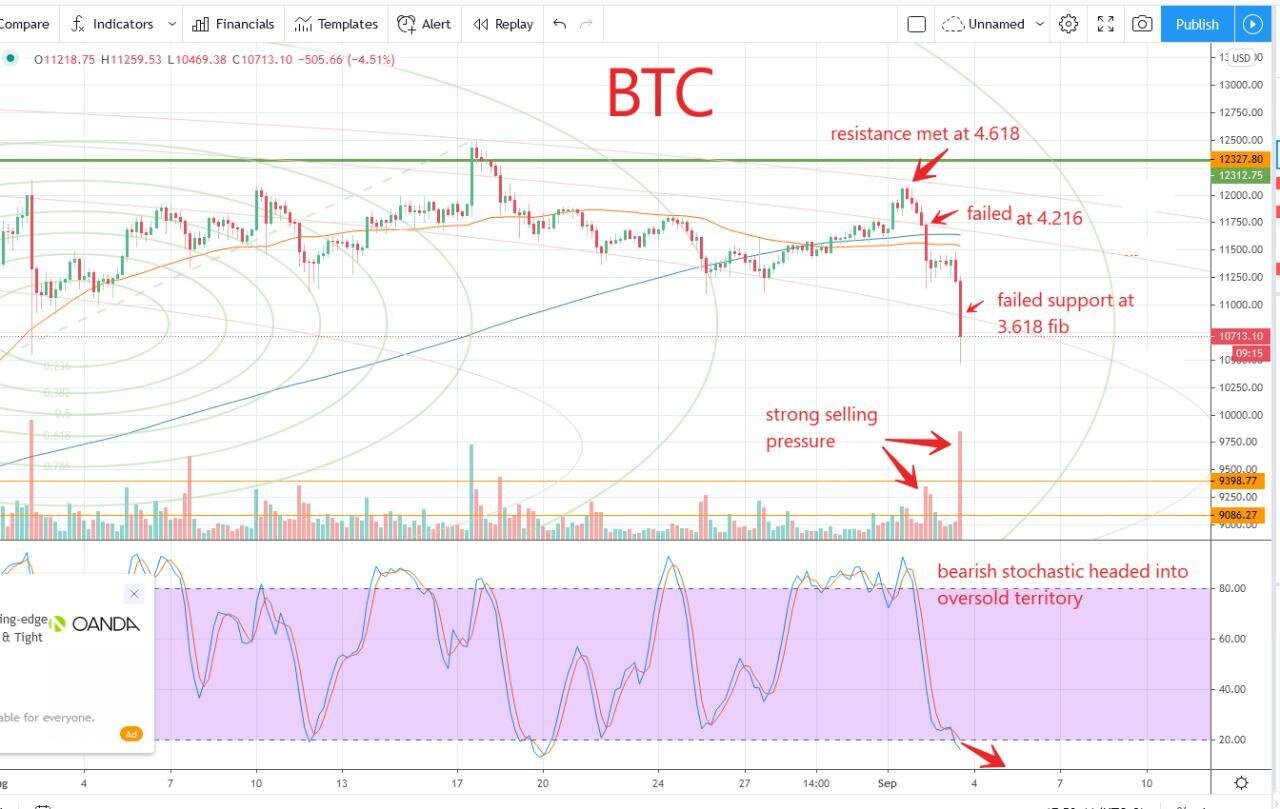
Looking at the 4-hour chart, we see that BTC met resistance at the magical 4.618 fib circle boundary. It then briefly clung to the 4.236 (sorry about the typo on the chart) before failing, and it blew straight through the 3.618 fib circle ring without pause.

With heavy sell volume happening already, and then the formation of that big fat ugly red candle that pounded the price down, there’s no telling where the price will land and find support now that we have sunken through the 3.618 fib circle ring. That was an important level to hold. The stochastic is very bearish, and we are making a definite move into the oversold zone where it could languish long enough to drop the price down a bit more.

When will the selling stop, you ask? The only possible landing point I can see is the CME gap set in July of 2020 at $9700. With over $348 Million in Bitcoin contracts that were liuidated in only 4 hours during this dump, the momentum looks like a train headed downhill that won’t even think about stopping before hitting that CME gap. I don’t have any doubt that the bulls will come out of the gates and go on a stampede IF we make it down to that CME gap. This might be the last chance to pick up on your favorite alts and buy Bitcoin at sub-$10k prices.

If we zoom in and look at the 1-hour chart, we can pick up a few more indications of how strong this event is on the micro level.

There is a definite death cross formation as the 50-day EMA crosses the 200-day EMA on this chart, and this is the designation given when both moving averages are on a downward slope. The 200-day EMA is just slightly sloping downward, but this is still indicative of a death cross, as evidenced by the harshness of the correction.

The 1-hour chart is just evidence to show us that this correction is significant and strong on the micro level, and it gives us a better picture of how things are developing while we are in the midst of the dive. I’ll be keeping track of the price movement on the 1-hour until we get to that CME gap, because there will be some buying decisions happening on my end!

Carlton Flowers
The CryptoPro

NOT FINANCIAL ADVICE - Entertainment purposes only. Seek a qualified investment advisor before making any decisions on purchasing cryptocurrencies.

MY LINKS:
CryptoPro YouTube Channel
Blog Site - www.carltonzone.com/cryptopro
Daily Update Mini Blog - www.carltonzone.com/coin-watch
Telegram Group - https://t.me/cryptoprocarlton
https://www.tradingview.com/u/carltonzone/

March 4th 2019 - Cryptocurrency Market Takes A Quick Dive

BTC Leads Altcoins on Rapid Drop

Today we saw Bitcoin surge to over $5400, and then take a dive, pulling down practically ALL of the altcoins on the market with it. I didn’t see either of these events coming, and it took most people by surprise. There is a lot of discussion on what the next few weeks hold in store for us.

In this video, we take a look at all of the Coinbase charts for the crypto leader board, and we notice that everything is in lock-step with Bitcoin. My question is, why would we see selling across the board, rather than BTC trading volume with the Altcoins?

My theory is that most of the action that took place today is from automated trading. That’s why the altcoins reflect all of the movements of Bitcoin. There hasn’t been a divergence for quite some time.

Everyone is also fervently discussing the current “mini uptrend”, and whether or not we will see a reversal and correction within a few weeks, or a shorter time period. How low will Master BTC go when the correction takes place?

The majority of prognosticators are calling for a bottom at 4200. The next possible level is 3800, which I am leaning towards. However, there are those that believe the final Elliot Wave 5 correction of BTC will drag it down to 2500 before the true bull market ensues. Time will tell!

What is YOUR prediction of the impending action? Do you have some technical analysis you’d like to share that supports your projected low point for BTC? Share it in the comments below!

Carlton Flowers
The CryptoPro

2019 Pipe Dreams & Bull Run Predictions - Here's the REAL Prediction

Why You Should Cautiously Turn A Deaf Ear to 99% Of the Prognosticators

2019 Bull or Bear.jpg

2019 is here, finally. And we arrived without the much ballyhooed “December Party” that we had last year in the cryptocurrency market. I for one was of the belief last year at this time that December of 2018 would be a repeat of what we saw in 2017. Obviously, it was not.

The 2018 December cryptocurrency party was canceled. The party-goers did not show up. The bulls were out to pasture. The moon got lost in the darkness of deep space, never to show its face. In other words, we were all wrong.

But many of the hard-headed prognosticators continue to call for a bull run, despite the evidence to the contrary. As I’ve said before, you better exercise extreme caution before you listen to any of the so-called “experts” calling for a bull run in the near future.

Here’s why…

In order to see how ridiculous it is to believe anyone claiming that Bitcoin and/or the entire cryptocurrency market will break out into a bull run any day now, all we have to do is look at the historic chart. This puts it in perspective, and underscores a point I have been making for almost a year.

Once February of 2018 hit, my head came down out of the clouds and I started to realize that we were probably on the verge of a bear market, despite the majority of people calling for a short “blip” and continued bull run. I braced myself for the long ride down, and at times, I doubted myself when the Elliot waves would temporarily push the entire market back into what people thought was a real bull run.

If you scroll back through my posts, you can see it. Sure, I did not predict the depth of the bear market dive, but I did actually predict the big drop to 3100 just a few days before it happened. I still have a smug grin on my face after calling that one, but I’m proud of how well I did in sticking my ground calling the bear market from February on despite what everyone else was saying.

But let’s get back on topic! All we need to do in order to fully understand where we are at this point in the market’s development is look at the historic BTC chart. Here it is:

As we can see, the 2017 bull run absolutely dwarfed the bull run of 2013. But if we look carefully, we notice the unspoken the truth of the situation staring us right in the face. It’s that big span of time between the bull runs. The market took 2 or 3 years of quiet accumulation before repeating.

Take a look where we sit right now. We’re still in the midst of aggressive downward momentum, as depicted by the red arrow. We are dangerously testing the strength 3100 support level that I spoke about in my previous post. We may have seen the worst of it, and could be ready to shore up strength and start to hold strong.

But looking at the chart from the historic standpoint, what reason could anyone possibly concoct as to why we would jump straight out of a bear slide into another bull run, without the 4 complete stages of market development taking place as they have all throughout history?

You are right, there are exactly none.

I’ve said it before, and I’ll say it again… the stock market AND the cryptocurrency market follow a 4-part pattern that is indicative of human nature and impulsiveness. First, we have quiet accumulation. Second, a consolidation phase with a bump in volume, The third stage is “markup”, where the feeding frenzy hits, and everyone dreams of getting exponentially rich overnight. The fourth is distribution, when all of the institutional buyers and “smart money” have left the unsuspecting public holding the majority of the positions. That’s when the balloon loses its hot air and slowly sails back down to earth.

I would invite anyone out there to show me when ANY of the markets have broken this natural pattern of development in our history. That includes the stock market, the commodities markets, and the cryptocurrency market. Until proven otherwise, it is safe to say that this is not the best time to be investing money you can’t afford to lose into the cryptocurrency market.

But that doesn’t mean this is a “doom and gloom” situation by any means. It’s actually a blessing in disguise. Now that we have seen what the cryptocurrency market is capable of doing, after the bull run of 2017, this bear market guarantees that we will have another chance to get some positions before the next bull run.

All that you need to remember is that it will take time, and history will more than likely repeat itself. History hasn’t failed us yet, and I don’t expect it to in the future!

Be safe out there.

Carlton Flowers
CryptoPro

Bottom-Of-The-Barrel Prediction on 2018 BTC Bear

Closing In on the Last Dip Before the Bull Run

BTC Low.jpg

It’s been a quiet spring and summer for me, but I have been watching the cryptocurrency market like a hawk. I haven’t had to say much, because the market has been doing exactly what I thought it would do… continue the correction.

But the question remains, just how low will big brother Bitcoin go before the bear market finally draws to a close? We will take a look at the latest chart from Trading view and we’ll discuss the possibilities.

Before I reveal my predictions, I will say that everything I called for since February of 2018 has been on-point. I wasn’t fooled by all of the premature bull market predictions. Exactly all of them have failed to come true. I’m still surprised that so many “experts” thought a bull market could emerge before the market has run its course.

Never in the history of the stock market OR the cryptocurrency market have we seen the pattern broken. You can set your clock by it. The four phases of accumulation, consolidation, markup, and distribution must happen. It’s scientific, and it’s the result of human nature combined with the extremely small percentage of “whales” who play the general public’s tendency to be controlled by emotion.

Since the inception of the stock market, we’ve seen it… after a major run, the insiders pull out and leave the public holding the bag. The lack of tremendous buying pressure leaves the market to fall, and the 4-step process repeats itself.

That being said, let’s take a look at the chart and I’ll share with you what I see in the range of possibilities.

11-18-18 BTC.jpg


Up until a week ago, we thought 6200 was the rock-bottom level for BTC. Last winter, my eyes were telling me that 5500 was possible, and at worst-case, 3200. I thought I was wrong. Nothing could have convinced me that we would ever see anything less than 5000 as of last month. But the dive we just witnessed opens those doors of possibility yet again.

Now that we have seen BTC violate the floor level of 6200 and even plunge below 5500, there’s no base that we can count on that will hold down the fort. We have to go to previous bull run levels to determine the new possibilities for bottom-level price action, which we see on this chart at 3200 and again at roughly 4200.

The velocity of the big dip we just witnessed tells me that it is entirely possible, and it can happen fast. We’re talking “in-the-blink-of-an-eye” fast. The overall momentum is still downward, and the rallies are not breaking the bear market pattern.

Take a close look at the stars that I have indicated on the stochastic chart. Whenever BTC was seriously oversold, it rallied hard. But you’ll notice that on each rally, the peak stochastic was was reflecting a maximum buying pressure point that did not break the overall downtrend.

After every rally, the peaks are lower. Look at the succession of red arrows which represent the declining peaks, confirming the continuation of the big ugly bear market. But after every smack-down, BTC found support at the base. Not on the last one.

That’s why we have to look at the previous support levels before the 2017 run to find out what is possible for the next low points. The orange box represents the “Bottom-of-the-barrel” zone of possibility, and this is a worst-case.

BTC could certainly rally and start a reversal. But it’s not likely, based on the recent action. It’s always best to prepare for the worst. That means you should consider a trading zone of 3200 to 4200 BEFORE you throw your money into the crypto market in anticipation of the December rally.

And yes, I did say December rally. I fully expect this to happen. We will see a rally. At worst-case, we will find a bottom point and then start the accumulation/consolidation phase in December with a nice spike that falls by the new year. Best case scenario would be BTC eclipsing the all-time high of 2017.

It’s best to assume that we have not yet had enough time to properly complete the accumulation/consolidation phase. We might be in for a boring 12 months if we don’t see a major spike in December of 2018. All we have to do is look at the history of the market, and it will give us clues as to what can happen.

The SAFEST way to play the market at this point is to wait until we have confirmation of a true bottom, with a nice flat quiet accumulation period. When the volume of the market jumps up like a shelf and we trade sideways again at new base levels, that will be enough evidence to tell us we are in consolidation, which is the safest time to invest in my humble opinion.

Make no mistake about it, cryptocurrency is the future, and it’s the natural evolution of trading value among human beings. Nothing will stop this from happening. The only question is, how long will it take before we hit critical mass?

Time will tell. Until then, we’ll keep our eyes on the charts.

Carlton Flowers
The Crypto Pro

The Cryptocurrency Bear Market Continues with BTC Leading the Dive

WHEN WILL BTC HIT THE BOTTOM? IS THE BEAR COMING TO A CLOSE?

Since February of 2018, we have heard time and time again from the so-called "experts" that we are on the brink of the next cryptocurrency bear market. Once again, we are experiencing another dive after major news hitting the market has told us otherwise. What is really going on?

In my previous article, we discussed the announcement of the Exchange-Traded Funds (ETFs) decision on behalf of the Securities Exchange Commission. This was the most recent bit of news that was supposed to send Bitcoin into the stratosphere, straight out of the bear trend. But time has proven the news wrong once again.

After this CNBC story was released that the Winkelvoss Twins were rejected in their bid to launch the first ETF ln a regulated exchange, the market took a temporary dive after we saw a brief run to $8,000 BTC. Within a week, news broke that the Securities Exchange Commission was going to delay their decision on approving ETFs as a whole until September of 2018. Immediately after, we saw the market take a nosedive.

Experts like Alessio Rastani and others reported that they did not believe BTC would fail to drop below the major support level of $6,800, with the probability of such a dip being 20% or less. But BTC had other plans, and made fools of the prognosticators once again.

What I have noticed since February of 2018 is that no amount of news will propel the market artificially into a bull run without allowing time for the natural phases of development to carry out. After the "distribution" phase of a market, or Bear Market, I believe history has proven to us that we have to see a time of accumulation where the market settles down and lays low.

Some call this the "dog days" of the market. This is what we have seen in the entire history of the stock market, and the cryptocurrency market has reflected the same, only in much shorter time periods. After the accumulation phase, we historically see a "consolidation" phase develop before a bull market ensues.

Digging back into the history of the cryptocurrency market, I fail to see a time where we have jumped straight out of a bear market into an all-out bull run. History normally repeats itself, but past performance is not a guarantee of future events. However, as volatile as the cryptocurrency market is, I truly believe it is safest to assume that we have to see these phases of development occur before a bull run can happen.

Common sense tells me that it would take an enormous amount of money to catapult the market from a slide straight into a bull run, and it would take an even greater amount of continuous buying pressure to sustain a run. You just can't get something from nothing, and it takes a constant influx of capital to keep a market propped up.

Human nature has proven this to be right throughout history. The masses of the general investors move on emotion, and the insiders with significant amounts of money invest in a contrarian way. They play off of each other, and it's usually the general population that ends up holding the short end of the stick when they start believing news releases that make improper claims.

BTC 8-7-2018.PNG

Looking at the current chart, we can clearly see that BTC is continuing in a bear trend after the brief run to 8,000 in late July. I don't think this is any mistake. BTC will have to find its rock-bottom point before an accumulation phase will follow. Right now, there are two possibilities in my opinion.

I could very well be dead-wrong, but we see that BTC failed a critical support level of $6800 this week, and is headed for the next support level of $6400. If BTC fails to hold $6400, we could very well see $5800 as a new possibility of the rock-bottom point. These critical support levels are shown on the chart in repeating intervals, and I believe this is due to automated trading activity.

The previous bottom point for BTC before the 2017 bull run was $5800. There is no magic to the prediction that $5800 could end up being the bottom point, because there are probably several trading bots programmed to buy big amounts at that point. Only time will tell. But it's best to assume the worst when you don't have money to lose in this market.

We will keep our eyes on the charts and watch the activity during the month of August, and carefully observe whether or not BTC finds that rock-bottom point before we enter the next phase of market development!

Carlton Flowers
CryptoPro

Should We Prepare for an Extended Crypto Bear Market?

WHY PLAYING IT "SAFE" COULD BE THE BEST STRATEGY

It's June 2018 and BTC continues its bear trend despite multiple incorrect predictions over the past few months from several noteworthy forecasters who thought the bull market should have already started.

The most common belief among the prognosticators was that $6,200 BTC was a big support level that would be a pivot point. As we now know, that prediction failed miserably.

The entire alt-coin market has also mirrored Bitcoin. None of the alts have broken free from the overall downtrend since the December 2017 all-time high. All of the alt coins appear to be in lock-step with big brother Bitcoin, and it is safe to assume that none of them have matured to the point that they can bust loose and deviate from its path.

The big question looming in everyone's mind is, "has Bitcoin hit rock-bottom?" But the question shoulnd't center around figuring out Bitcoin's "rock-bottom" price. It should be understanding what happens overall, based on how price activity develops.

When you look at the big picture, you can decide if you're the type of person who would feel more comfortable holding a position for several years through the ups and downs, or if you prefer to take a break in the short-term until the market turns around.

My advice to everyone is to play it safe and look at the worst-case scenario, despite all of the talk about an immediate reversal. In order to do this, we must look at the 1-week chart dating back as far as possible to get a birds-eye view.

BTC 1 Week 2018.PNG

In this analysis, we'll take a look at the overall action on the 1-week candles for Bitcoin dating back to 2016. It's necessary to zoom out as far as possible in order to get an idea of what the worst-case scenario could be.

Let's begin by identifying the current trend. In Figure 1, we can clearly see that the current downtrend is not your average correction in the midst of a rising market. After the peak in December 2017, we see lower highs and higher lows for 6 straight months.

The last time we saw an extended bear market like this was from November of 2013 all the way to January of 2015. That was a bit more than one solid year of a downtrend. But what we need to pay the most close attention to is what happened at the end of that extended bear market, which I notated in Figure 2 below.

BTC 2013 Bear Market Annotated.png

Before the 2013 bull run spike, we saw smaller breakouts and corrections that did not span the time of what we saw in this overall picture from 2013 to 2015. This is key.

In January of 2015, a quiet accumulation period of 9 months developed before the the market ticked up to the next accumulation level in June of 2016. That next level of accumulation lasted through April of 2017. We could actually call this a period of "consolidation".

In April of 2017 the bulls took full control and the charge started. It took us all the way to Bitcoin's peak of over $19,000 before getting swatted down despite all of the hype and anticipation of breaking the $20,000 barrier. The bear market officially started, and continues on through today.

The biggest point that I want to make is this: we have yet to see a bull run jump right out of a bear market without a period of quiet accumulation followed by a consolidation phase.

It just doesn't happen! Trend reversals take time to develop, and you can't short-cut the process. That's why it is best to turn a deaf ear to all of the ridiculous bull market predictions that we have been seeing week in and week out since the all-time high.

Going back to Figure 1, I believe that the worst-case scenario that we all have to take into consideration is the trading zone delineated by the red box. I don't base this solely on the history of BTC, but by the age-old rule of the four phases of market action which are as follows:

  • Accumulation
  • Consolidation
  • Markup
  • Distribution

This is how the stock market has traded in all of history, and the only difference between the stock market and the cryptocurrency market is the time it takes to move through all four of these phases. The cryptocurrency market cuts the overall time down from 13 year cycles to a year or two.

After the all-time high in December of 2017, we have a period of "distribution", or an extended selloff. Before we can see the next BTC moon-shot, we have to see an accumulation and consolidation phase. It won't happen overnight.

While I am not a financial advisor or a professional who gives investment advice, I think everyone can learn from what history has taught us. And for those of us who are not able to invest a Brinks truck full of cash into the crypto market, it's best to play it safe and take the most conservative approach to investing.

Time will only tell. I could be dead-wrong. But taking this approach to predicting the next BTC movement will certainly prevent me from losing the last bit of change jingling in my pockets.

Carlton Flowers
The CryptoPro