MATIC 1-Day Chart Technical Analysis
/OVERALL STRENGTH INDICATED BY IMPRESSIVE OBV
Okay folks, let’s take a look at the MATIC 1-day candlestick chart provided by TradingView this morning. I see some very positive indications on this chart of great things to come.
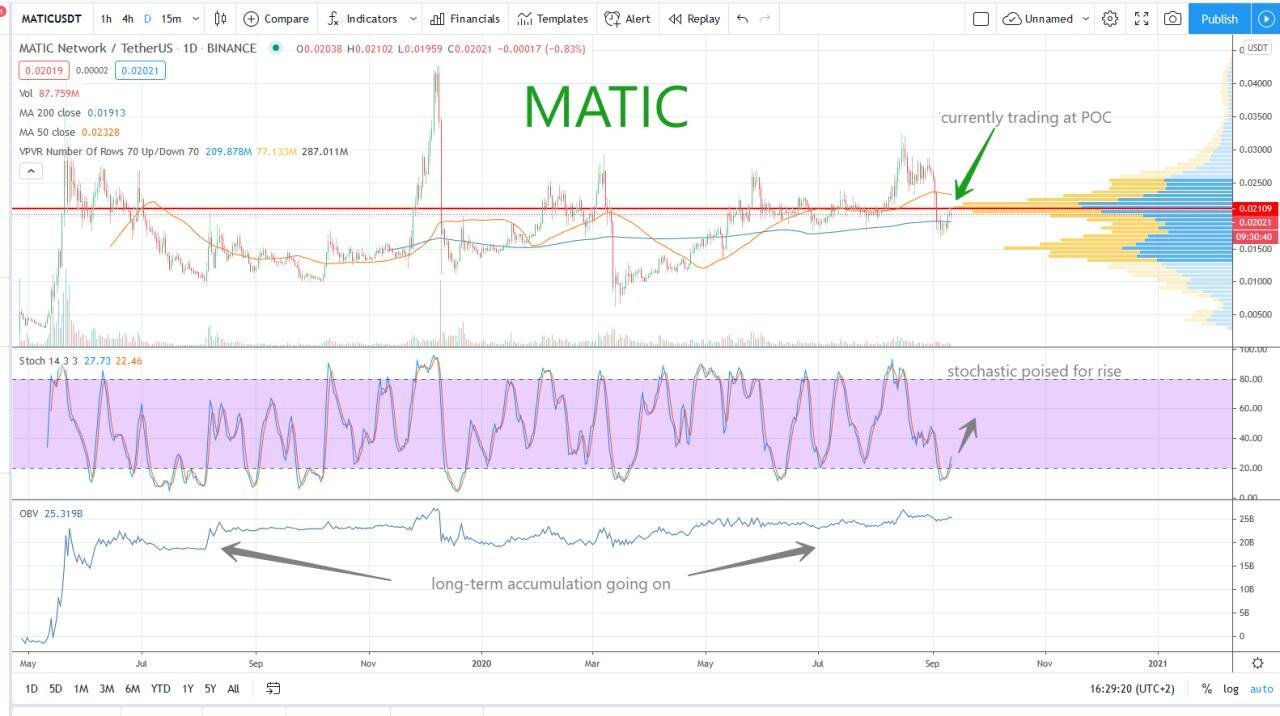
First off, I like the long-term accumulation shown on the OBV. This is not always 100%, but it is often accurate. What this nice rise and then steady holding line means is that institutional buyers are holding this and stacking.
Current trading price is exactly at the Point-of-Control on the D-shaped Volume Profile. A D-shape on the volume profile is indicative of a well-balanced state of trading. If a strong correction across the crypto market were to occur, 0.015 looks like a possible settling point as we see the strong bar at that price per the volume profile.
But the stochastic is poised to rise, as it is just now shooting out of the oversold zone, with a nice positive trajectory. That means the probability of a price hike is fairly high, as opposed to a dip down to previous levels. Whatever the case, the future is looking bright for this project as per the chart.
I will have to look into grabbing a bag of MATIC. If I do, you’ll get a special report on the next “I Got A Bag!” video on the YouTube channel.
Carlton Flowers
The CryptoPro
NOT FINANCIAL ADVICE - Entertainment purposes only. Seek a qualified investment advisor before making any decisions on purchasing cryptocurrencies.
MY LINKS:
YouTube Channel - https://www.youtube.com/channel/UCfRbpFKfYxAc9WVUZHwo1NQ
Blog Site - www.carltonzone.com/cryptopro
Daily Update Mini Blog - www.carltonzone.com/coin-watch
Telegram Group - https://t.me/cryptoprocarlton
https://www.tradingview.com/u/carltonzone/