XRP 4-hour TA Shows Possible Slide to 0.20
/VOLUME PROFILE SUGGESTS MOVE TO LOWER SUPPORT LEVEL
XRP appears to be preparing to move down a notch to a lower support level, if these indicators are communicating a truthful picture. Let’s take a closer look at the 4-hour chart provided by TradingView, and break down those indicators.
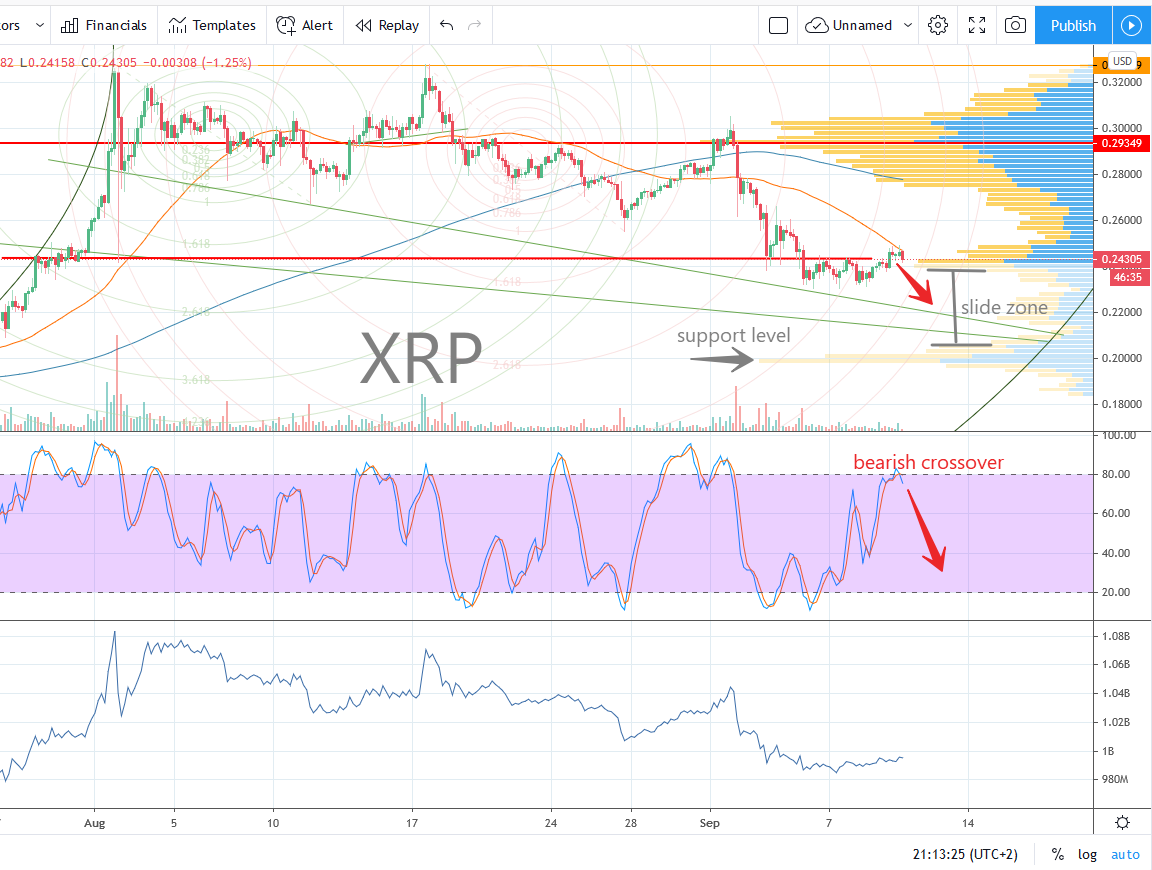
The biggest clue on the chart is the stochastic. It is clearly rounding off and pivoting, looking like it’s ready to exit the overbought zone that it just barely entered, with the fast line crossing over the slow line and a downward trajectory. Volume is quieting down, which is a confirmation of downward trending.
When we look at the Volume Profile, we see that the next landing spot where heavy institutional trading has taken place is squarely at 0.20. The 0.18 to 0.21 range could be a landing spot for the next consolidation move. With a good clump of volume taking place within this range previously, this will probably act as a magnet on the price line now that we see the indications of the downward movement.
I don’t know what the extent of this correction will be, but at WORST-case, 0.15 is the next lower clump of institutional trading volume that the price line could fall to. I don’t see this as a negative event, IF it does come to fruition. With the overall overwhelming institutional consolidation going on with XRP since 2017, this would simply be another buying opportunity, in my opinion.
Time will tell! I don’t see this as a losing situation. I remain VERY bullish on XRP moving into the fall of 2020.
NOT FINANCIAL ADVICE - Entertainment purposes only. Seek a qualified investment advisor before making any decisions on purchasing cryptocurrencies.
Carlton Flowers
The CryptoPro
MY LINKS:
YouTube Channel - https://www.youtube.com/channel/UCfRbpFKfYxAc9WVUZHwo1NQ
Blog Site - www.carltonzone.com/cryptopro
Daily Update Mini Blog - www.carltonzone.com/coin-watch
Telegram Group - https://t.me/cryptoprocarlton
https://www.tradingview.com/u/carltonzone/