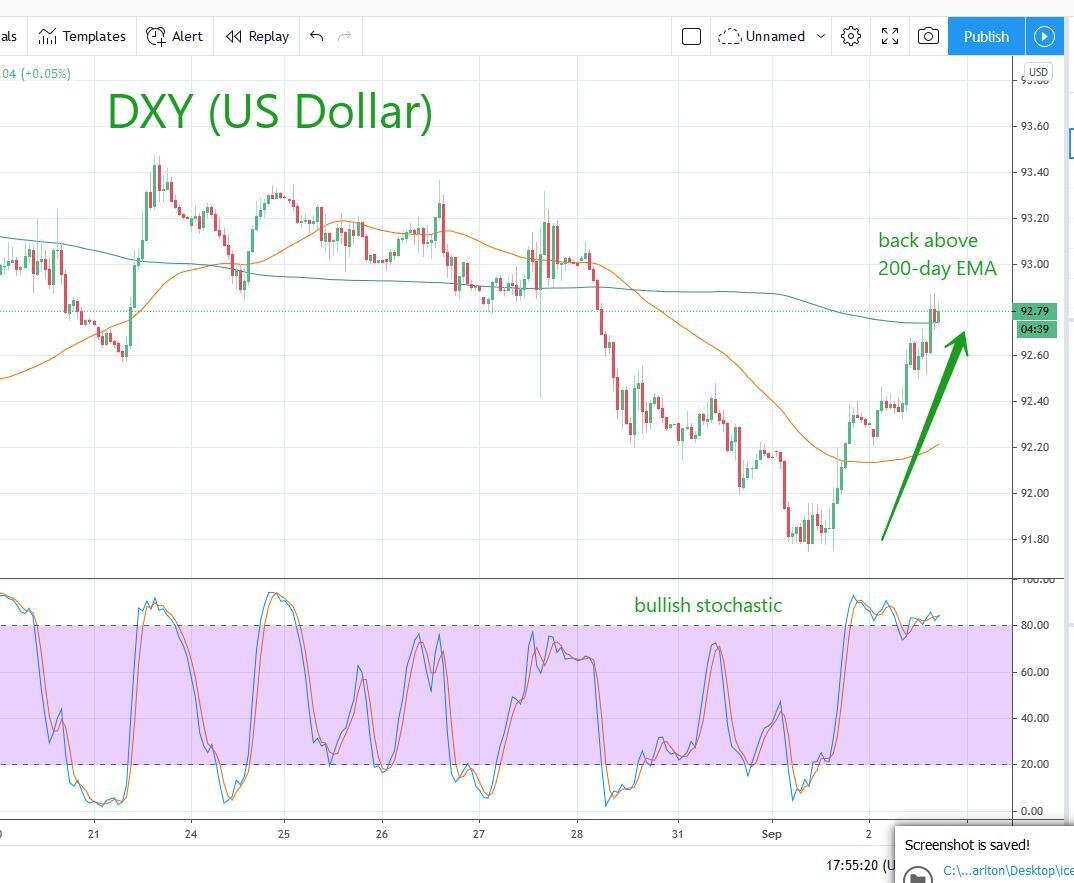
Take note that DXY (US Dollar) is making a strong move back upward, re-establishing a position above its 200-day EMA. We don’t know how long this move will last. But we DO know that strong DXY moves tend to coincide with BTC corrections. We will keep our eyes on the DXY chart for correlation evidence.
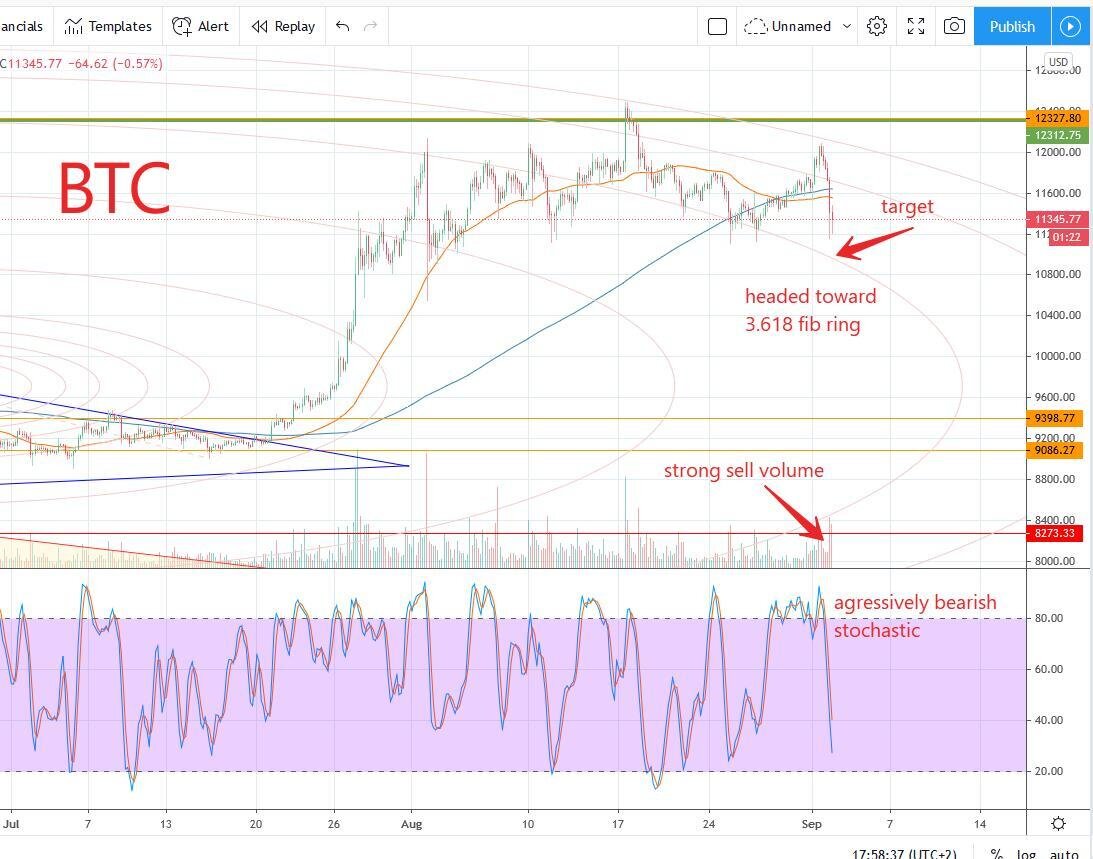
While we are trading below both exponential moving average lines, I do see a possible stopping point at around $11,000 when the BTC price line hits the magical 3.618 fib circle ring that I have constructed on my TradingView chart. If you want the starting and ending points of this magic fib set, you can check it out on my TradingView site at the link below.
The stochastic is looking angry, with a definitive and aggressive downward move that will probably land in the oversold zone, which we have not been in for quite some time. There is a possibility that this correction could take BTC lower, and the price action after the crossing of the 3.618 magical fib circle ring will give us clues.
Watch the volume. If we get some fat red candles, or if volume just slows significantly, this would combine for quite a correction. I’m waiting to see if that CME gap in the $9,000 range will be filled, or forgotten. Time will tell.
Get on my YouTube channel and subscribe if you haven’t yet. New entertaining content is coming!
Carlton Flowers
The CryptoPro
NOT FINANCIAL ADVICE - Entertainment purposes only. Seek a qualified investment advisor before making any decisions on purchasing cryptocurrencies.
MY LINKS:
YouTube Channel - https://www.youtube.com/channel/UCfRbpFKfYxAc9WVUZHwo1NQ
Blog Site - www.carltonzone.com/cryptopro
Telegram Group - https://t.me/cryptoprocarlton
https://www.tradingview.com/u/carltonzone/