ALERT! The DXY Is Set to Explode - Down Cycle Is Nearing Completion!

TECHNICAL INDICATORS ON DXY HINT AT PENDING REVERSAL

Gang, you better be ready for this. It looks like the downtrend cycle for the DXY is just about to complete on the 1-day chart. The stochastic is nearing the bottom. The MACD histogram is bottomed out. The oscillators are headed to a possible bottom and will reverse. With the lower Fed rate announced, there's no reason to believe that the DXY won't explode out of this and wreck Bitcoin. Something to definitely consider, while everyone is being overly bullish.

I’ll be watching this closely, and will have a video update coming on Monday with further analysis!

Carlton Flowers
The CryptoPro

Bitcoin (BTC) 4-Hour Technical Analysis for 9-2-2020

BTC MAKES STRONG CORRECTION AFTER RUN TO $12K

We've got some strong red candle action happening on Bitcoin as it is currently dipping down to $11,342. That's quite a correction after briefly surpassing the $12,000 mark. Let’s take a look at the indicators and price line clues on the chart provided by Tradingview.

The price line is taking a vertical dive on moderate to strong volume, just days after the 50-day EMA has crossed under the 200-day EMA. This could be a slightly bearish indication in the short-term, and confirms this bearish trading channel on the micro level.

Take note that DXY (US Dollar) is making a strong move back upward, re-establishing a position above its 200-day EMA. We don’t know how long this move will last. But we DO know that strong DXY moves tend to coincide with BTC corrections. We will keep our eyes on the DXY chart for correlation evidence.

While we are trading below both exponential moving average lines, I do see a possible stopping point at around $11,000 when the BTC price line hits the magical 3.618 fib circle ring that I have constructed on my TradingView chart. If you want the starting and ending points of this magic fib set, you can check it out on my TradingView site at the link below.

The stochastic is looking angry, with a definitive and aggressive downward move that will probably land in the oversold zone, which we have not been in for quite some time. There is a possibility that this correction could take BTC lower, and the price action after the crossing of the 3.618 magical fib circle ring will give us clues.

Watch the volume. If we get some fat red candles, or if volume just slows significantly, this would combine for quite a correction. I’m waiting to see if that CME gap in the $9,000 range will be filled, or forgotten. Time will tell.

Get on my YouTube channel and subscribe if you haven’t yet. New entertaining content is coming!

Carlton Flowers
The CryptoPro

NOT FINANCIAL ADVICE - Entertainment purposes only. Seek a qualified investment advisor before making any decisions on purchasing cryptocurrencies.

MY LINKS:
YouTube Channel - https://www.youtube.com/channel/UCfRbpFKfYxAc9WVUZHwo1NQ
Blog Site - www.carltonzone.com/cryptopro
Telegram Group - https://t.me/cryptoprocarlton
https://www.tradingview.com/u/carltonzone/

7-16-2019 BTC Drops Below Critical Trend Line - Is Tether "Printing" Responsible?

BULL RUN COULD BE DONE AS TREND LINE IS VIOLATED

This is the most simple technical analysis we need on understanding what is going on with BTC at the moment. There is no need to go overboard with complex technical indicators when Bitcoin price action shows us something as simple and significant as this.

This move, combined with the rather “sketchy” activity of Bitfinex wildly printing Tether tokens of recent, could explain why this is happening.

First, let’s look at the critical move which could be a foretelling of the short term movement of Bitcoin price action…

When you draw a baseline from March 29th 2019 to June 9th, 2019, which by the way seems to be a popular baseline of analysis by many prognosticators of the day, we see that the Bitcoin price line has violated this base of support for the first time since this rally picked up a full head of steam.

We have already watched a major lower high form, along with 2 major lower lows, which is already an indication of possible trend reversal. I’ll be posting a more detailed analysis of these critical pivot points on the next post. But combining those facts with the current violation of the base leaves a clear indication that the short term bull run might be ending.

All hope is not lost, however. This current bull run has been highly suspect from the jump. Why? Because Bitcoin has NEVER cut short the standard market cycles over time, since its inception. The four phases of accumulation, consolidation, markup, and distribution have followed a steady trend of increasing in length of time to develop. This is a very normal and standard way that all markets develop.

But when the run to the all-time high in 2019 broke free from the standard cycle time and cut it short, I was suspicious. I truly believe that the run-up was fueled by the continuous “printing” of Tether by the Bitfinex Exchange, which continuously happened in large chunks of millions of Tether tokens.

This smacks of manipulation and conflict of interest. Why would the Securities Exchange Commission allow it to continue? We may never know. But what we do suspect is that Bitfinex does NOT hold a one-to-one backing of Tether tokens as they claimed when the token was first introduced into the market.

As per Bitfinex, the Tether token was introduced to allow faster movement in the market, providing a much-needed bridge between Bitcoin and other altcoins, to facilitate quicker settlement and movement in and out of fiat currency & cryptocurrencies. The concept was that every Tether token was backed by $1 in USD to provide liquidity, should a “run on the bank” (or the Tether token) occur.

But as time went on, the regulatory authorities and news reporting agencies suspected that the Tether token was not backed 100% by USD reserves. Now it is plainly obvious that it is not. What I believe is happening is that Bitfinex is “betting” on a small percentage of people cashing out their Tether tokens for USD after making trades.

In other words, when an individual cryptocurrency investor sells their Bitcoins, they are placing their bets on the majority of people holding on to their Tether tokens to trade them into altcoins, or wait for the price of Bitcoin to move rather than cashing out and converting the Tether into USD to be deposited back into their bank accounts.

This is the same game that banks play when they only hold a fraction of the amount of money from deposits of their customers. If you have $1 million in a bank account, the bank will leverage that deposit and lend it out many times over. It is a gamble, but as long as there isn’t a “run on the bank” (think Mary Poppins and the bank disaster), the bankers will make fortunes leveraging the deposits of others.

Each time Bitfinex printed millions of Tether tokens, they were able to gobble up BTC at higher-than-market prices, which could be why the price of Bitcoin rose so fast. But this scam would not be possible if Bitfinex were forced to show proof of the 1:1 backing of the Tether tokens if they were audited.

This is my theory of why Bitcoin price was driven up beyond the normal value, which had the result of spurring a run before the bear market cycle was completed. Now we are seeing the BTC price coming back down to Earth, heading towards the 100-day exponential moving average.

By the time this correction is done, we might be right back where we should be, completing the bear market cycle in the time frame that it should have run its course. Time will tell.

As always, this is not financial advice, and I am not a financial advisor. I am just the skeptical Cryptocurrency watchman, exposing the evidence of cracks in the foundation like Sherlock Holmes!

Until next time, let’s enjoy the action. More to come!

Carlton Flowers
The CryptoPro


5-27-2019 BTC Could Be Forming Smaller 2nd Bull Flag

IS THIS BULL FLAG NUMBER 2 FOR BITCOIN?

BTC 5-27-2019 2nd Bull Flag.png

It’s Monday night, Memorial Day, and if my eyes aren’t fooling me, I’m pretty sure that I am staring at a smaller, flatter bull flag formation. If this is what I think it is, we’re probably going to see a break to $9,000. What intrigues me the most is the fact that this bull run has not taken a breath since we were at the initial run to $5,000.

Just as it did in the previous bull flag formation, the baseline is holding nicely. As long as BTC does not fall below that base, my best guess is that we see another spike. They are coming hard and fast, and I would NEVER have thought this was even possible before it happened.

Bitcoin has made a fool out of me since it broke out of the doldrums and surpassed $5,000. Each and every time it surged, I expected a pullback. But the correction never came. Here again, it’s old news. BTC has broken new ground.

I think I need to write a disclaimer because I am tired of saying “this isn’t financial advice”. Heck… I don’t even know what regulatory agency is snooping on my blog site waiting for me to say the wrong thing, or not say the magical phrase. Oh well. Onward we go!

Post your predictions in the comments. Also, I’d like to know if you believe we are in an absolute bull market right now, or if you believe this is just a bull run within the bear market. Let the debate start!

Carlton Flowers
The REAL CryptoPro

BTC Bull Flag Confirmed, Breakout Was On-The-Money

BTC Forms Perfect Bull Flag - Breakout At Apex

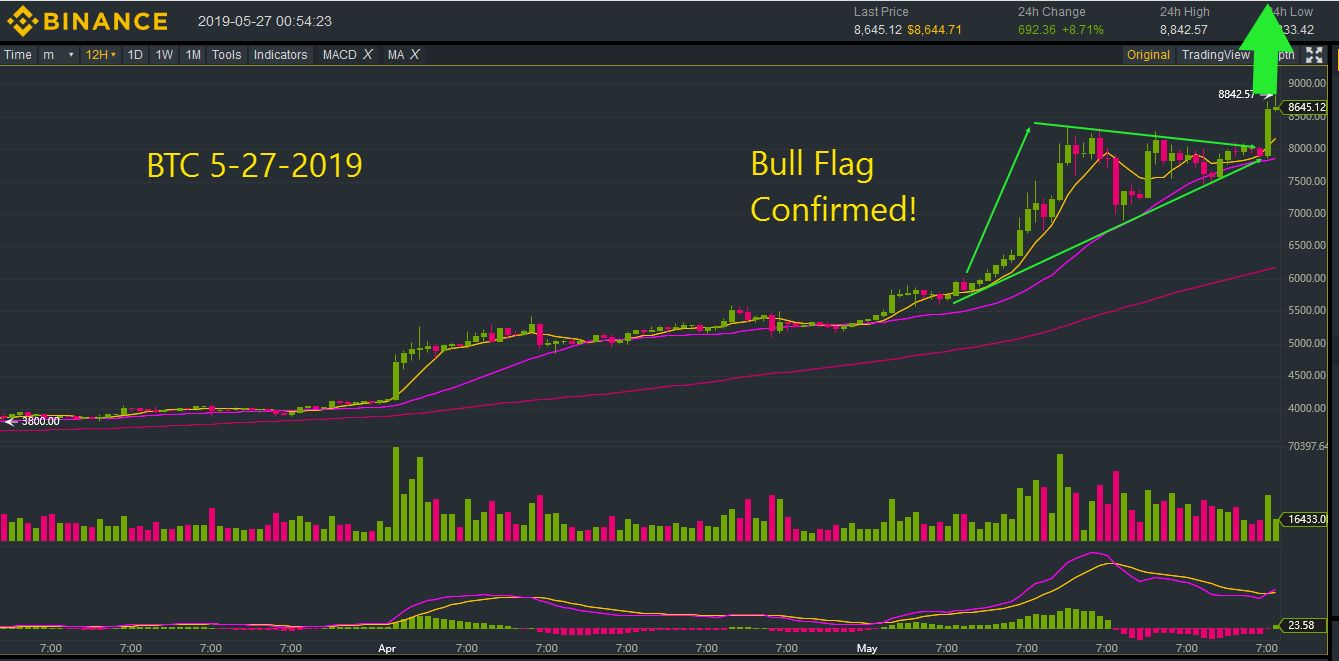
Let’s look at 2 snapshots that I took over the past few days. The first was taken on May 24th, 2019 when I first notated the bull flag forming. When I took this screenshot, I figured we would have either a breakout to the positive or a dump within 3 to 5 days.

5-24-2019 BTC Flag.png

A dump would have occurred if the candles violated the lower limit of the ascending triangle, thus invalidating it. But as we see, the candles stayed true to the boundaries and allowed the price action to make it to the apex, hence the breakout.

BTC 5-27-2019 Bull Flag.png

The big question in everyone’s mind right now is, how long is this run going to last before we correct? Time will tell. My best guess is that we can plow forward to $9,000, and possibly even $11,500. But after that, I just don’t see the price holding up.

Of course BTC has made a complete fool of me for the entire month of May, with each tremendous surge after we all thought the correction HAD to come. As much as we think the correction has to take place, we get another surge. Seems like the animal refuses to be tamed.

We’ll keep our eyes on the action over the next few days, and see what happens when June 1st hits. Last year, we saw a dump as soon as the month of May was in the books. Will BTC and the Alts repeat last year’s action? Or will it surge ahead? Place your bets!

Carlton Flowers
The CryptoPro