XRP Short Term Outlook - Double Top Confirmed?

XRP Completes Double Top With Lower High

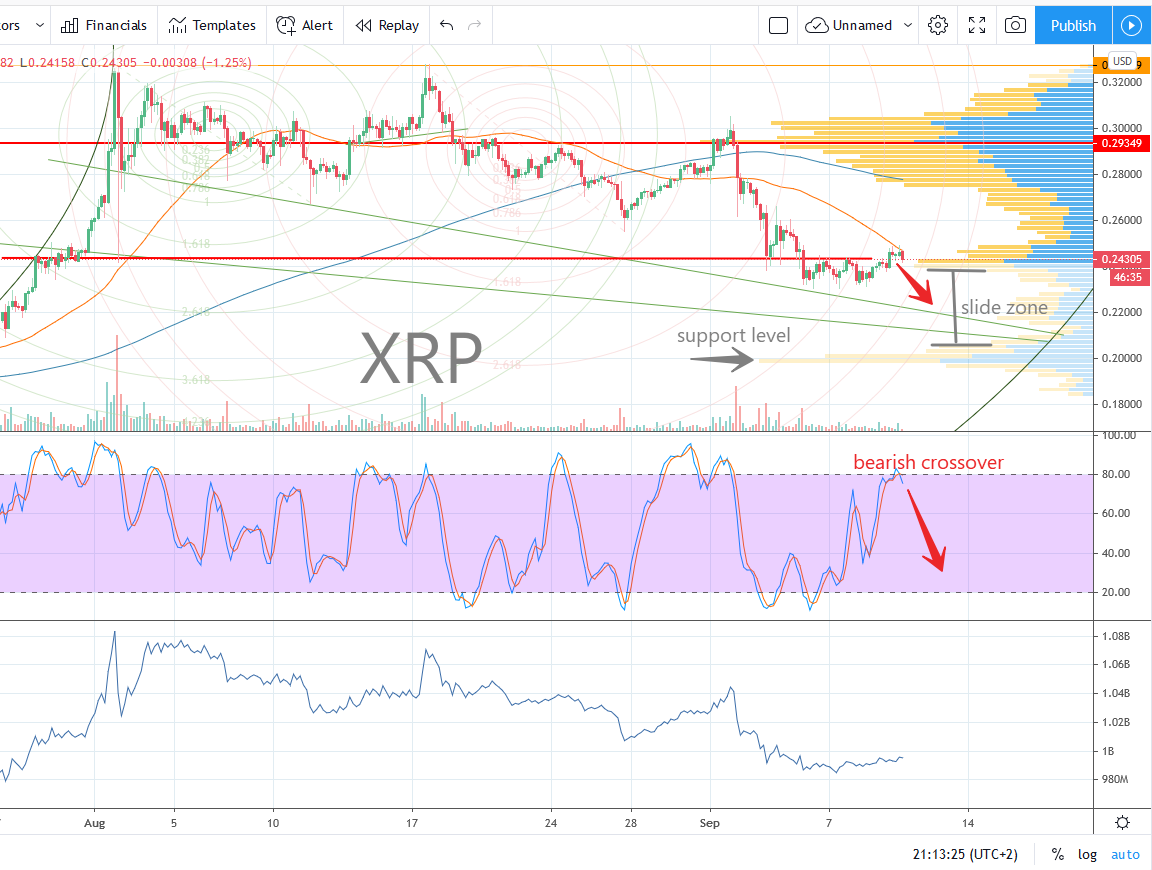
XRP starts the month of December 2020 with a confirmation of a lower high indicated by point 2 on the chart. Note that the price dipped down to the 50-day EMA, previously wicking down below the line. This could be indicative of a further drop in price.

The stochastic looks weak, with downward momentum that could be the beginning of the correction cycle. The On-Balance Volume looks relatively stable, not showing any significant dumping. But we are still in the early stages of this movement, so it is not possible to to determine if a dump will be incoming.

The volume profile shows possible price targets indicated by the arrows. If downward momentum keeps up, these price targets could get realized. Depending on what happens with BTC, further downward movement could be coming as we move into the month.

Carlton Flowers
The CryptoPro

Earn FREE Tokens on Coinbase!
CLICK HERE for the Compound (COMP) tutorial
CLICK HERE for the Stellar Lumens (XLM) tutorial
CLICK HERE to sign up for Coinbase and get $10 free Bitcoin

Visit the CryptoPro YouTube channel here by clicking the link or image below!

CryptoPro YouTube Channel - Weekly Updates and  Cutting-Edge Technical Analysis

CryptoPro YouTube Channel - Weekly Updates and Cutting-Edge Technical Analysis

DISCLAIMER

NOT FINANCIAL ADVICE - Entertainment purposes only. Seek a qualified investment advisor before making any decisions on purchasing cryptocurrencies. The crypto market is very volatile, and trading can be dangerous and detrimental to your financial situation. Proceed with caution.

XRP Short Term Outlook - Possible Price Targets

XRP Corrects While BTC Takes Break

XRP 11-18-2020.png

The short-term outlook shows a slight decline in price while overall XRP looks more bullish than it has since the 2018 run. As the volume profile shows 3 definite clusters peaking at 0.30, 0.286, and 0.272 as indicated on the chart. These are possible price targets for the next few days as BTC takes a breather. There is always the possibility of settling back down to the current POC (point of control) price at 0.25 (red arrow).

The on-balance volume shows a lot of heavy distribution since the recent peak. Profit taking looks strong, but the OBV does appear to have settled down at the previous level which is a good thing. The stochastic is weak, and currently shows a possibility of continued downward movement.

If the next surge in Bitcoin takes it to the all-time high of $20,000, we could see a surge back towards 0.30 or higher. But it could also spark movement away from XRP and into BTC. I’m waiting and watching, taking note of when the next big correction takes place to time another buy.

Once we hit the final BTC correction, which in my opinion could happen at any time OR if and when BTC reaches $20k, I’m looking for a strong correction across the board in the alt market. Once the alts settle down from the current surge, this could be the final major correction before an “alt season” starts.

I am definitely waiting on the sidelines not placing any buy orders until we see that correction take place, although there is no guarantee that it will happen. Until it is clear, I’m taking a cautious stance to maximize my own accumulation before the next surge sets in.

Carlton Flowers
The CryptoPro

Earn FREE Tokens on Coinbase!
CLICK HERE for the Compound (COMP) tutorial
CLICK HERE for the Stellar Lumens (XLM) tutorial
CLICK HERE to sign up for Coinbase and get $10 free Bitcoin

Visit the CryptoPro YouTube channel here by clicking the link or image below!

CryptoPro YouTube Channel - Weekly Updates and  Cutting-Edge Technical Analysis

CryptoPro YouTube Channel - Weekly Updates and Cutting-Edge Technical Analysis

DISCLAIMER

NOT FINANCIAL ADVICE - Entertainment purposes only. Seek a qualified investment advisor before making any decisions on purchasing cryptocurrencies. The crypto market is very volatile, and trading can be dangerous and detrimental to your financial situation. Proceed with caution.

XRP 4-hour TA Shows Possible Slide to 0.20

VOLUME PROFILE SUGGESTS MOVE TO LOWER SUPPORT LEVEL

XRP appears to be preparing to move down a notch to a lower support level, if these indicators are communicating a truthful picture. Let’s take a closer look at the 4-hour chart provided by TradingView, and break down those indicators.

XRP 4-hour TA.png

The biggest clue on the chart is the stochastic. It is clearly rounding off and pivoting, looking like it’s ready to exit the overbought zone that it just barely entered, with the fast line crossing over the slow line and a downward trajectory. Volume is quieting down, which is a confirmation of downward trending.

When we look at the Volume Profile, we see that the next landing spot where heavy institutional trading has taken place is squarely at 0.20. The 0.18 to 0.21 range could be a landing spot for the next consolidation move. With a good clump of volume taking place within this range previously, this will probably act as a magnet on the price line now that we see the indications of the downward movement.

I don’t know what the extent of this correction will be, but at WORST-case, 0.15 is the next lower clump of institutional trading volume that the price line could fall to. I don’t see this as a negative event, IF it does come to fruition. With the overall overwhelming institutional consolidation going on with XRP since 2017, this would simply be another buying opportunity, in my opinion.

Time will tell! I don’t see this as a losing situation. I remain VERY bullish on XRP moving into the fall of 2020.

NOT FINANCIAL ADVICE - Entertainment purposes only. Seek a qualified investment advisor before making any decisions on purchasing cryptocurrencies.

Carlton Flowers
The CryptoPro

MY LINKS:
YouTube Channel - https://www.youtube.com/channel/UCfRbpFKfYxAc9WVUZHwo1NQ
Blog Site - www.carltonzone.com/cryptopro
Daily Update Mini Blog - www.carltonzone.com/coin-watch
Telegram Group - https://t.me/cryptoprocarlton
https://www.tradingview.com/u/carltonzone/

6-16-2019 XRP Breakout Clues

FLAG FORMATION HINTS AT XRP BREAKOUT IN JULY

upload.jpg

I'm paying close attention to the flag formation on the ​24-hour chart. If the bullish tend holds up, this might indicate a move to the 0.60 level in a flash.

upload.jpg

Looking at the 1-month chart, we can clearly see that the downward trading channel has been broken by recent trading activity.​

On my Tradingview account, I posted an idea where another large Triangle formation is showing up. The interesting thing I noticed is that the Apex of the triangle also coincides with the 0.618 fib circle line. Doesn't seem to be a coincidence to me.​

My best guess is that XRP will experience an immediate break to the upside within a day or so, and then another major move at the Apex of the larger triangle formation.​

This could also bomb at the Apex of either of the triangles. Watch closely, and check out my Tradingview account to see the details on the fib circle coinciding with the triangle apex.​ You can check out the details on this particular scenario on my Tradingview account at https://www.tradingview.com/chart/XRPUSD/XPM455Hy-XRP-Decision-Point-at-End-of-July-2019/.

Share your thoughts! As always, this is not financial advice. Trading is risky business, seek the​ advice of a financial advisor before making any decisions.

Carlton Flowers​
TheCryptoPro​