5-27-2019 IOST Continuing Strong Uptrend Move

IOST RIDING TRIANGULAR MOVEMENT FOR SEVERAL DAYS

IOST 5-27-2019.png

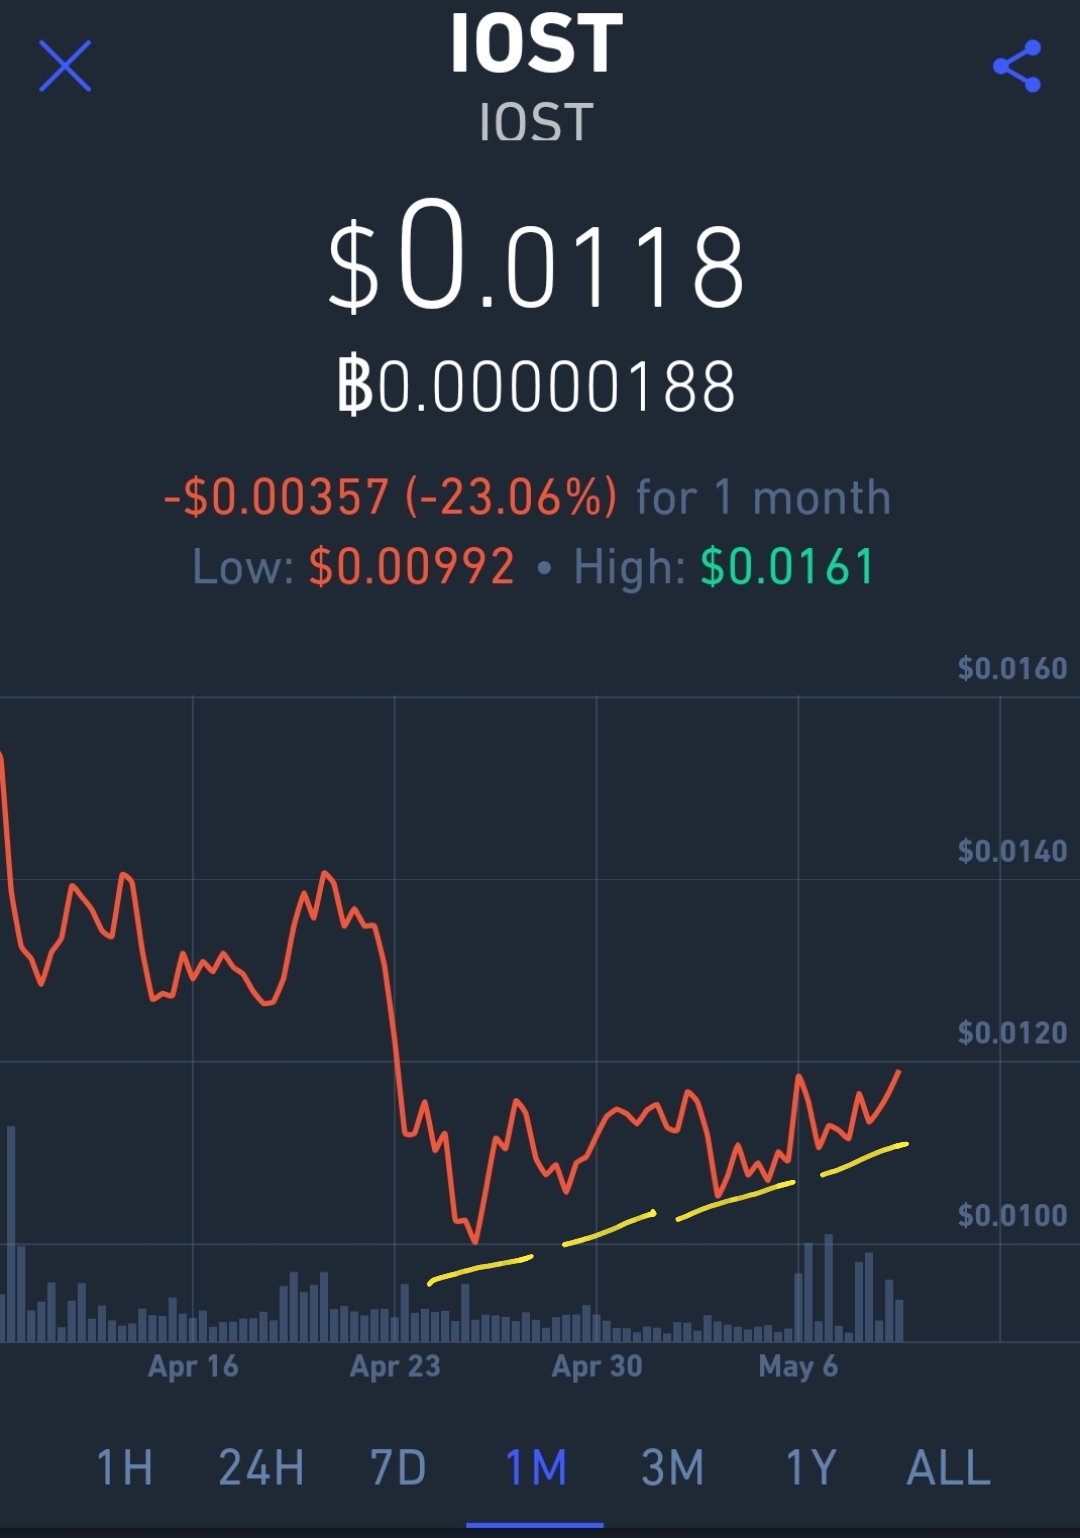
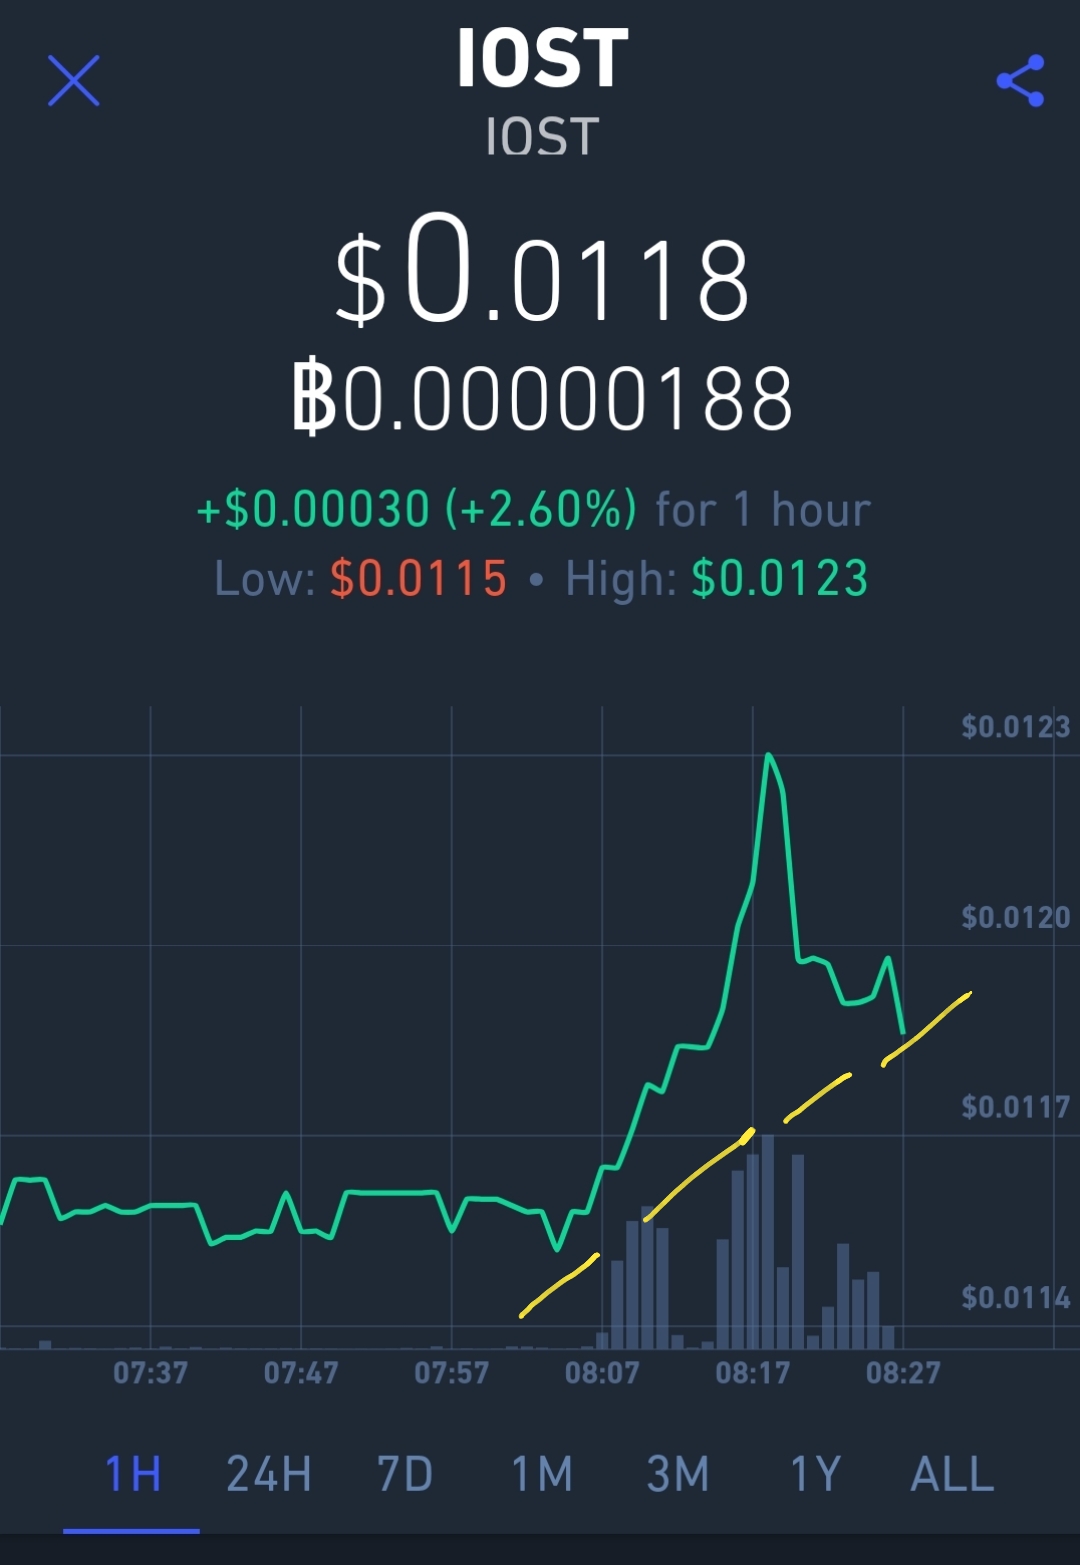
As we approach June 1st, my eyes are on this current trend. I’ve been watching this movement for the entire month, and it’s only getting better. Will it continue through the month of June, or will IOST take a summer break?

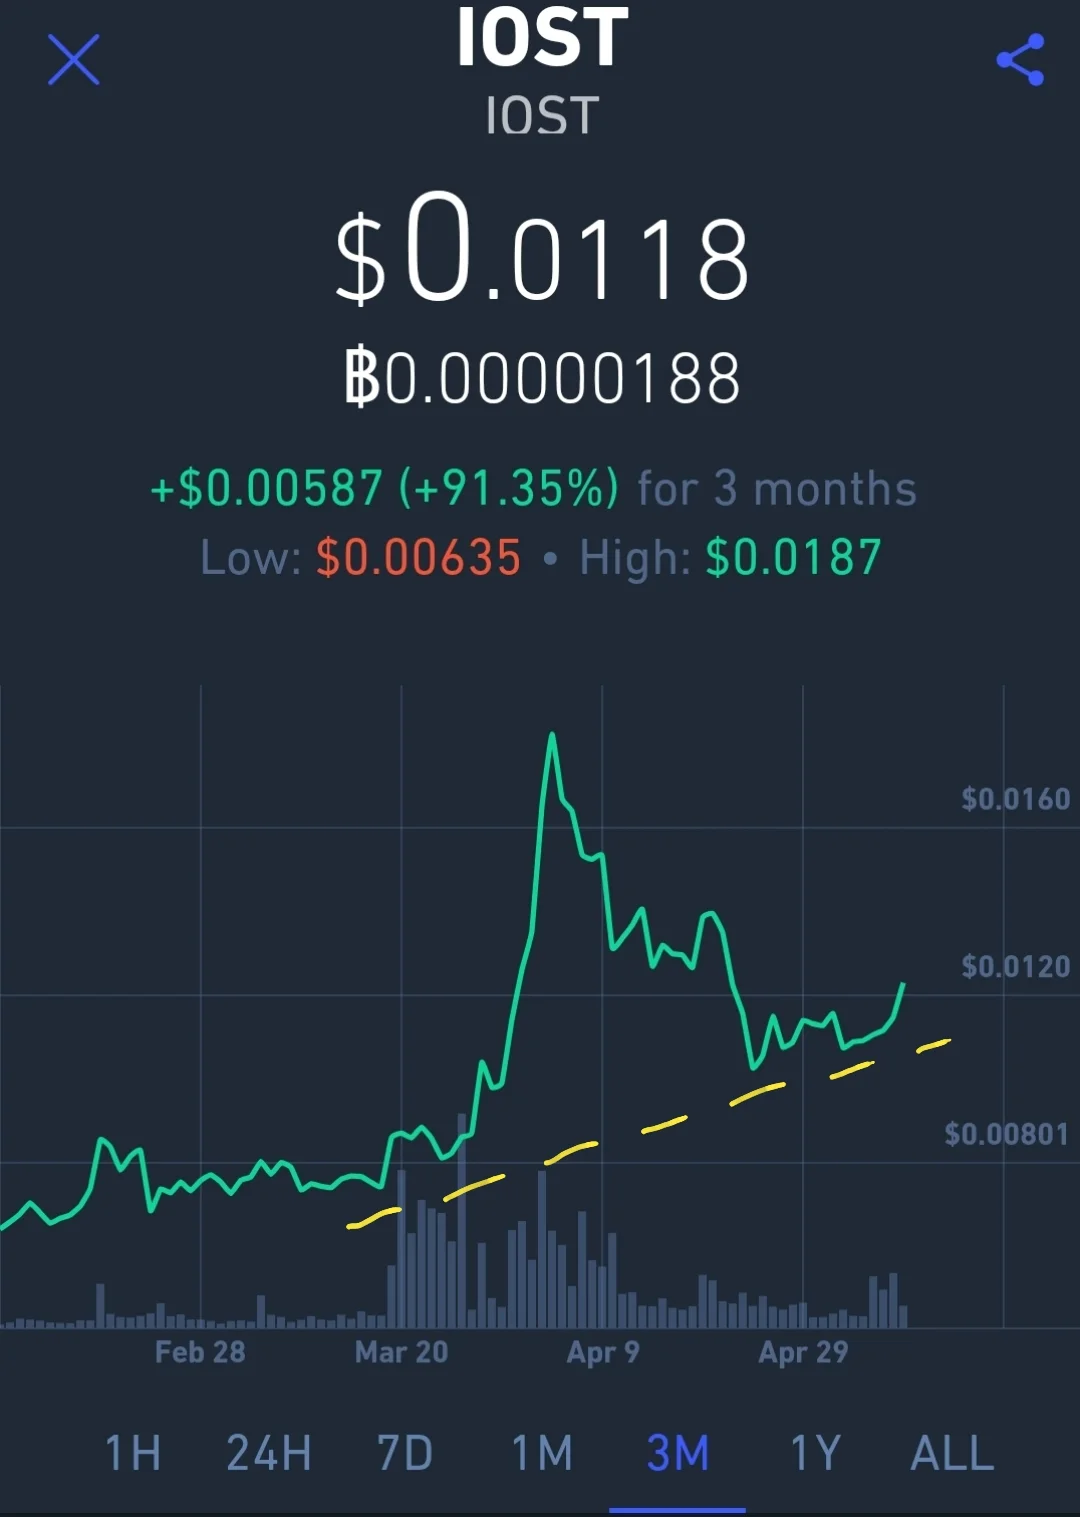
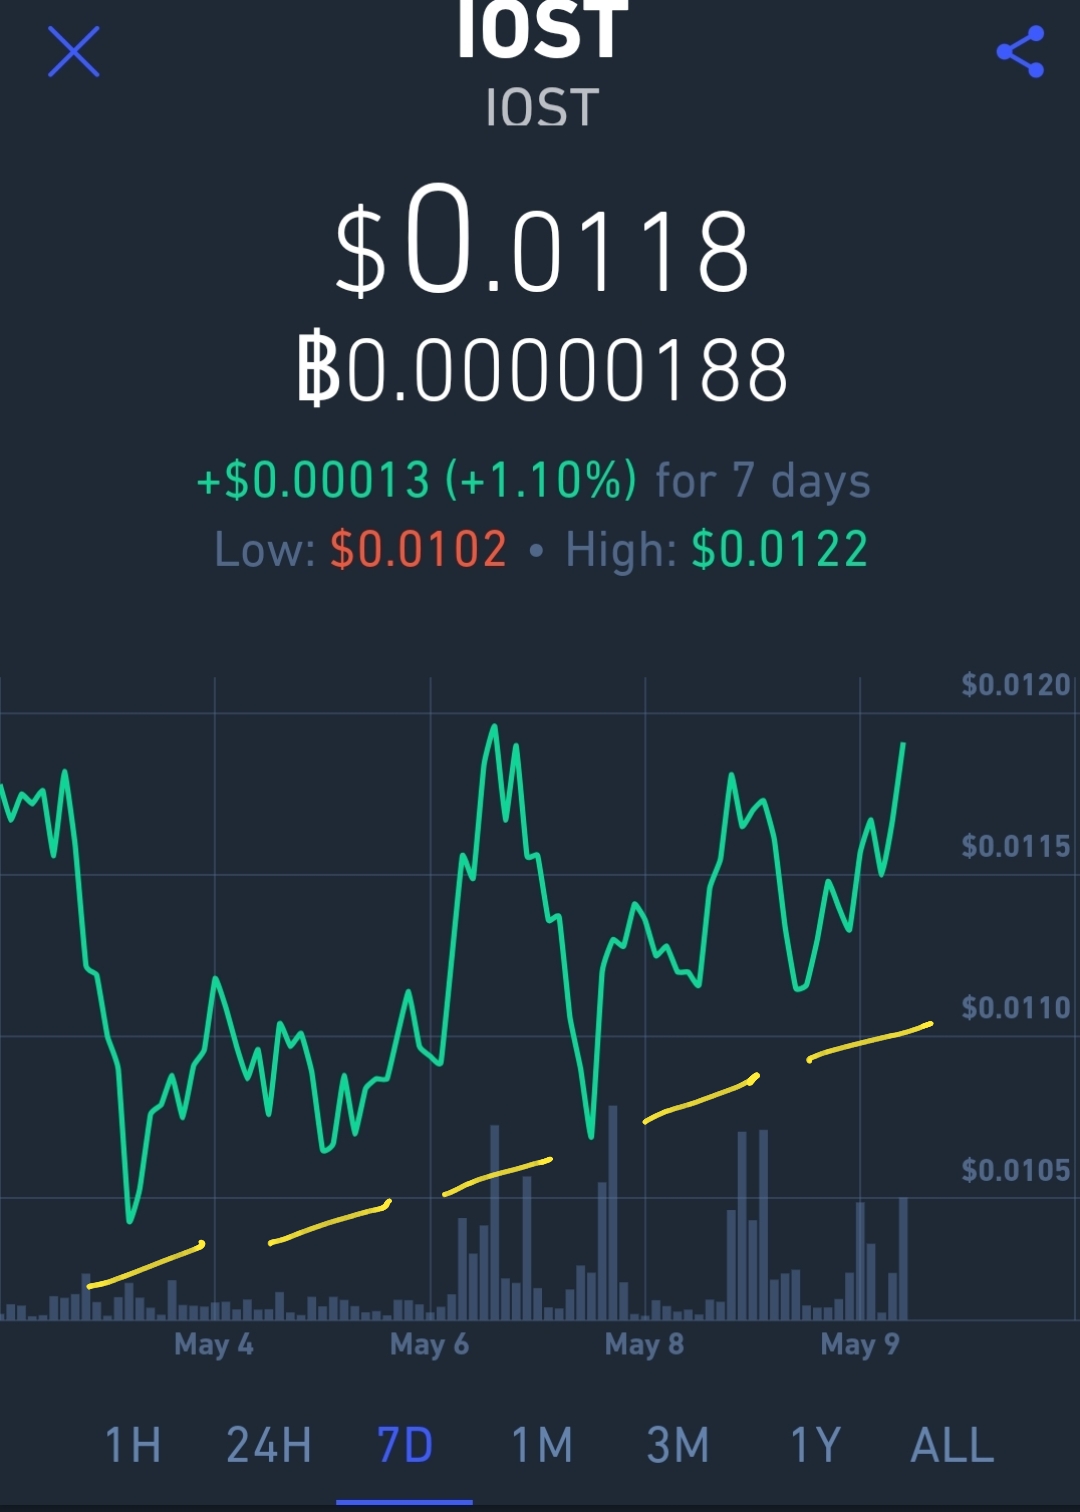
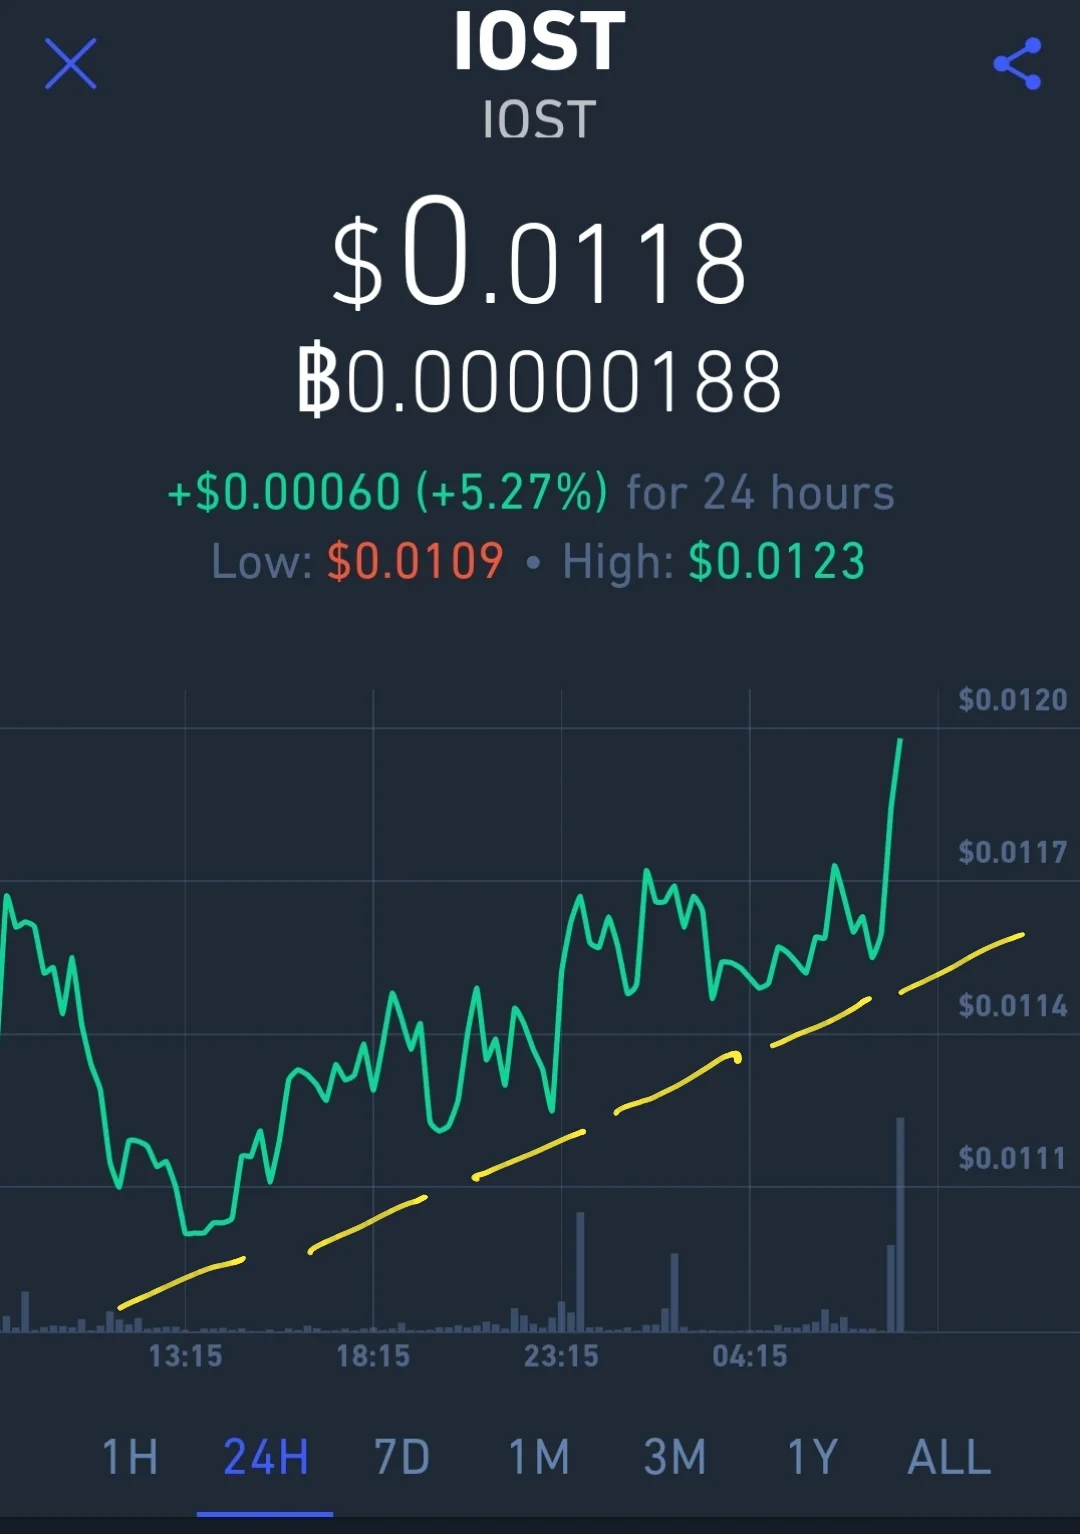
Looking at this chart, we had a bit of a correction phase that ended on May the 23rd. Since then, the general baseline has been on the incline. If the 5-day EMA were shown on this simple chart, you would see the price action bouncing off of that line.

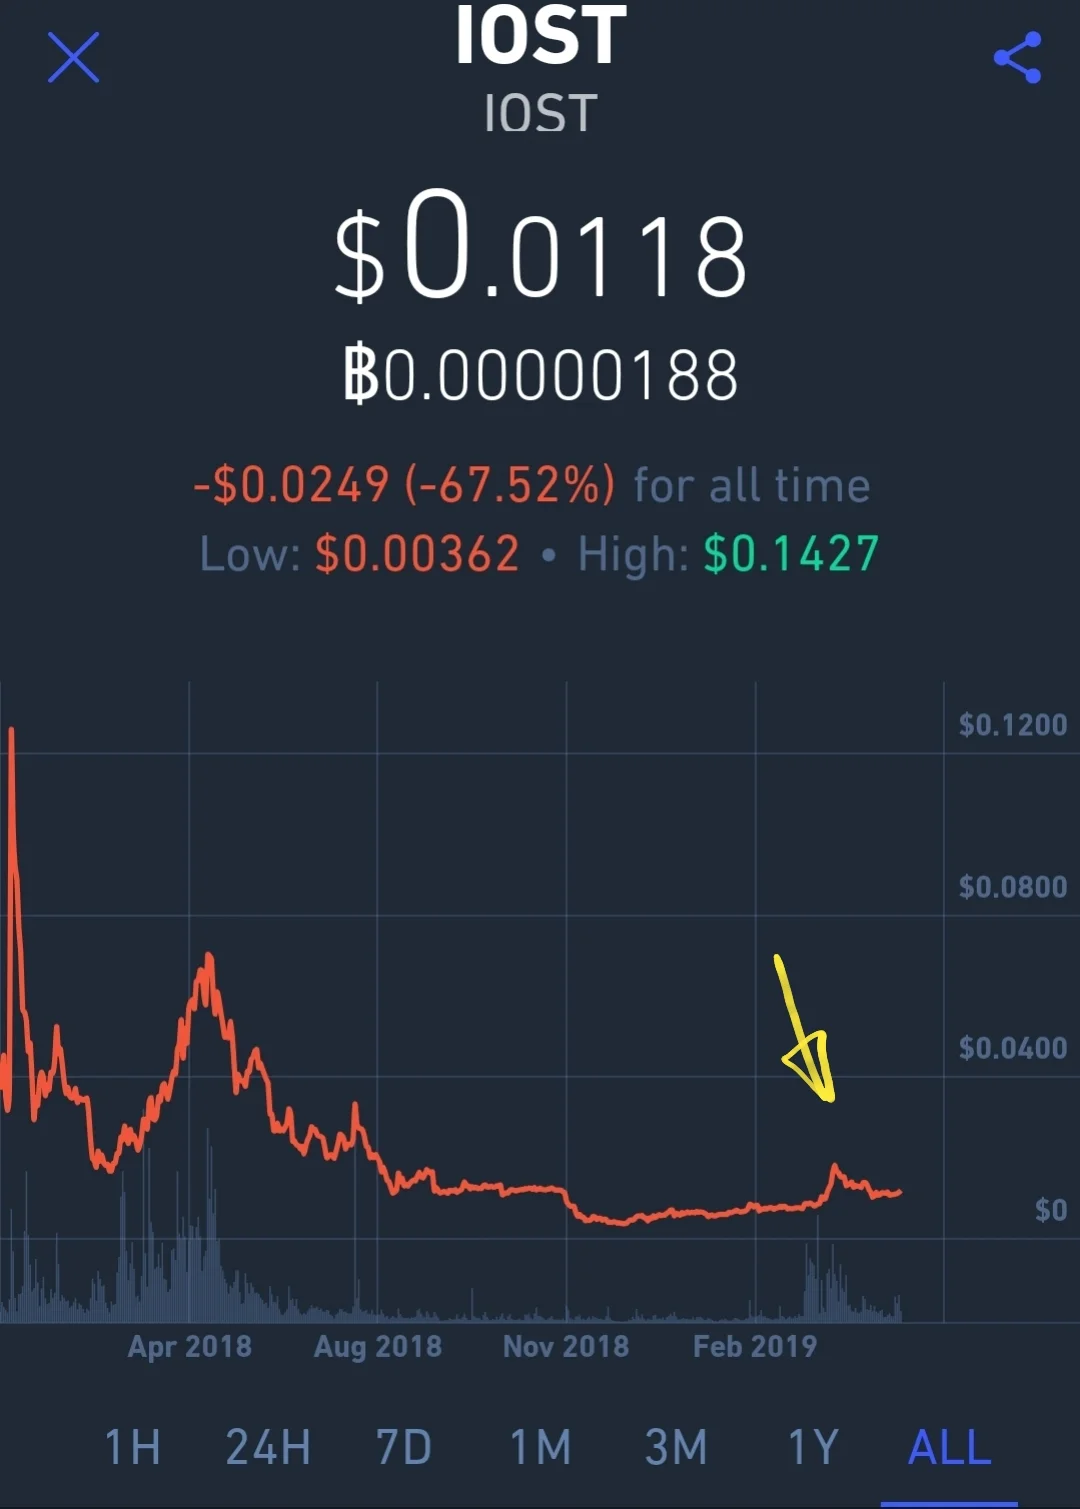
It’s hard to believe that the all-time high for 2019 is only 0.014, as we rapidly approach that level during this bull run. If the run continues, I look for 0.014 to be surpassed before the 1st of June. All bets are off after that point, because summertime has not been nice to the altcoin market in the past. But we shall see.

Do your due diligence, and as usual, this isn’t financial advice. Use your head. Don’t play with money you cannot afford to lose. Let me know what YOU think IOST will do in the next few days, if you have some technical analysis to share.

Now let’s have some fun and watch this thing play out in the next few days!

Carlton Flowers
The CryptoPro


BTC Bull Flag Confirmed, Breakout Was On-The-Money

BTC Forms Perfect Bull Flag - Breakout At Apex

Let’s look at 2 snapshots that I took over the past few days. The first was taken on May 24th, 2019 when I first notated the bull flag forming. When I took this screenshot, I figured we would have either a breakout to the positive or a dump within 3 to 5 days.

5-24-2019 BTC Flag.png

A dump would have occurred if the candles violated the lower limit of the ascending triangle, thus invalidating it. But as we see, the candles stayed true to the boundaries and allowed the price action to make it to the apex, hence the breakout.

BTC 5-27-2019 Bull Flag.png

The big question in everyone’s mind right now is, how long is this run going to last before we correct? Time will tell. My best guess is that we can plow forward to $9,000, and possibly even $11,500. But after that, I just don’t see the price holding up.

Of course BTC has made a complete fool of me for the entire month of May, with each tremendous surge after we all thought the correction HAD to come. As much as we think the correction has to take place, we get another surge. Seems like the animal refuses to be tamed.

We’ll keep our eyes on the action over the next few days, and see what happens when June 1st hits. Last year, we saw a dump as soon as the month of May was in the books. Will BTC and the Alts repeat last year’s action? Or will it surge ahead? Place your bets!

Carlton Flowers
The CryptoPro

5-10-2019 IOST Chart Looking Better Than Ever On All Levels

NO MATTER HOW YOU SLICE IT, THIS LOOKS GREAT…

IOST 1 - Year.jpg

I haven’t seen IOST chart out like this in over a year. In fact, I haven’t seen any of the alts look so good on all levels of the chart. If I had to make an educated guess, I would say that IOST is positioned quite well for the altcoin run in 2019.

I’ve been sitting on this coin since first buying a bag in 2017, before the historic BTC run to $19,000. I watched IOST spike, and fall tremendously in the bear market in 2018 and through the present time. I put IOST on the shelf, and have not thought much about it since then. But yesterday I happened to give a closer look to the price action, and this is what I observed.

For starters, let’s look at the 1-year price line. Coming down from resulting spikes during the fall from the all-time high, IOST settled into a fairly quiet period of accumulation.

IOST 2 - 3mo.jpg

The price line remained flat for better than 6 months. Then the volume spike came out of nowhere, and we wee the classic “bump” in price. This is the first clue that I look for that must precede a new bull market. Very low volume followed by a buying frenzy, bump up in price line, and a correction to levels above the accumulation base.

Moving right along, let’s zoom in closer and see what IOST looks like on the 3-month price line chart. What we see here is a definite overall trend to the positive, following the correction that came after the volume and price spike.

This is exactly what we want to see pre-bull run. If the price had corrected to a point at or below the accumulation base, I would have called this a false alarm. But there is a consistent, definite overall uptrend shown by the dashed yellow line that we can call an ascending base.

It’s even nicer to see that ending spike bouncing off of the ascending baseline. It will be a key determining factor on whether or not IOST can continue this trend. If the price line does not violate that base line, we could end up seeing a massive ascending triangle, or “pennant” formation. It’s gonna be party time if that’s what is in the cards.


IOST 3 - 1mo.jpg

Let’s zoom in even further and see what the 1-month price action shows us. For half of the month, we’ve been on that nice overall ascending trend line, ending with the bump of volume on the end of the 3-month chart that we can see a little bit closer.

Momentum up on the monthly compliments the positive momentum on the 3-month and 1-year price lines quite nicely, and you rarely ever see this.

I was so pleasantly surprised to see such a nice continuation of the evidence supporting a bullish pre-run, if that’s even a word. Some people would rather call this the “consolidation phase”, where the hike in volume comes along with a higher trading range. This chart definitely supports that assessment.

But well pound it down even closer, and see if the 7-day chart still paints a bullish trend.


IOST 4 - 7day.jpg

The 7-day price line chart is where I really start to pay attention for helping on buying and selling points. It’s really important to know if you’re at a reversal point, or still trading in an upward or downward channel before you decide to jump in and buy, or sell. Looking at the IOST 7-day chart, it’s still looking like this token is in play.

You’ve still got a clear view of that ascending baseline with a consistent trading range above it, ending on a nice note. And the volume bars coincide well with the price peaks. That’s nice.

There’s nothing worse than seeing a coin go on a run on little to no volume. That smacks of manipulation. But this chart looks like it makes sense, with the volume to price relationship.

If I wanted to buy in, or grab a few more bags of this coin, I’m looking for a swing point off the top of the recent peak with a target down on the yellow ascending baseline. Of course it’s never a guarantee for things to work out perfectly, but that’s the best way you can go about it when you’re trying to come in with the most leverage.

So let’s zoom in even further, and see how it looked for the day on the 24-hour chart, and then zone in to the 1-hour chart!

IOST 5 - 24hr.jpg

Okay, this is a gorgeous 1-day price line. Zooming in on this 24-hour view, the price action is equally impressive, bouncing along the ascending trend line. When we see a 24-hour chart like this, it makes it super easy to find a buying point. It just doesn’t get any better.

The volume bars still coincide nicely with the price peaks, and the corrections find firm support along the base line without losing ground. That’s very attractive.

Whenever you zoom in and find a sloppy chart with erratic action that doesn’t obey any trend lines, it makes it hard to settle on buying and selling points.

Taking it all the way in to the 1-hour price chart, I was shocked to see yet another beautiful work of art that would make child’s play of buying in. You’ve got a trend line that is easily depicted, and volume bars that match the surges in price. And it ends on a bullish note!

IOST 6 - 1hr.jpg

I would absolutely love it if I could find cryptos with price action charts that look like this, where it paints a clear picture all the way from the 1-year chart down to the 24-hour and even 1-hour charts. But sadly, this is a rare occurrence. I don’t know if I’ll ever even see anything like this again, so it was fun to document it for future reference.

This is what the crypto trader or HODLr has to keep their eyes peeled for when on the hunt for grabbing coins with a potentially explosive future. The charts can be very telling, and these are the patterns I watch out for.

The way I see it, you have to play it as if you could lose 100% of your money, while looking for the evidence that might give you the chance to grab something at an extremely low price that might take a moon shot in the future. That way you minimize risk, and maximize your slim chances of striking it rich.

That’s what makes crypto prospecting fun and exciting!

Carlton Flowers
The CryptoPro


11-20-2018 BAT Basic Attention Token Approaches Target Price

BASIC ATTENTION TOKEN TARGET OF $0.10 IN RANGE

BAT 11-20-18.PNG

First of all, I love the idea behind Basic Attention Token (BAT). This is a token that will be used to reward viewers for watching advertising content. Rather than paying for traditional means of online advertising, Basic Attention Token creates a more efficient user-targeted approach that makes a lot more sense than traditional social media ads.

This is a great looking chart. It couldn’t be any better than this. We are in the midst of a good bear market, and we’ve seen 3 declining peaks since the December 2017 run. Looking at the baseline for BAT which also appears to be descending, a safe target that I may chose to jump on this crypto could be $0.10.

I think that’s as good of a guess as any. The reason being, this token has real utility. Lots of thought was put into it, and I would actually consider using it as a marketing tool. So that gives me more confidence that this token may not go to zero and fizzle out one day.

As far as the projected low, there’s no telling how far this market will go before it bottoms out. Ten cents might be the bottom. Or it could be a tenth of one cent. Nobody really knows. But judging from the previous run, I would be happy to take a gamble at ten cents and then HODL until I feel like the bull market is in full effect.

Check out the background on this one and I think you’ll like what you see. They are listed on Coinbase, which means they must have a fair amount of fundamental credibility. Coinbase is very slow to add coins, and they are making history by being one of the lucky few to be added after the Big Three.

If I pull the trigger, I will report back and track my progress. So, let’s cross our fingers and hope for a BAT MOON!

Carlton Flowers
The CryptoPro

Disclaimer - I’m not an investment advisor, so don’t follow my advice. Contact a broker for financial and investment advice. All posts made are for information and entertainment purposes only.

Cryptocurrency Coin Watch - The Launch!

COIN WATCH MICRO BLOG - BACK IN ACTION

Coin Watch Mini Blog.jpg

Announcement! I am back into the technical analysis trading game! Back in 2013, I got back into penny stocks and started the "Stock Watcher" micro blog for trading penny stocks that were in play. But I got super busy with my businesses, and had to step away from it.

In 2017, I discovered the cryptocurrency market, and how similar it is to the OTCBB and trading penny stocks. The great thing is, just about all of the same technical indicators and chart patterns work for crytpo coins just like they did for the penny stocks.

I've decided to re-launch the mini blog and rename it to the "Coin Watch" blog. I'll be posting my trading ideas and chart updates to help those of you who trade cryptocurrencies to take advantage of this wild market.

I will still give general updates about the current state of the market over on the main crypto mini blog, but this will be for those of you who want to learn more about active trading. It goes without saying, I am NOT a financial advisor, and trading on the cryptocurrency market is EXTREMELY risky. The market is very volatile, so if you don't like wild roller coaster rides, think twice before you ever hit that "buy" button based on one of my recommendations.

Don't forget about the Crypto Resource Page with all of the links to my favorite cryptocurrency resources. I will keep that updated as time goes on.

Stay tuned and please post your comments and questions!

Carlton Flowers
CrytpoPro Supreme