IOST 4-Hour TA

SLIGHT CORRECTION, THEN MOVE TO NEXT LEVEL?

I'm sitting on 9500 of these tokens, and forgetting about it. I think IOST is looking strong overall, with their recent decision to push the project into DeFi. The chart for this technical analysis comes from the TradingView.com website.

IOST 9-2-2020.jpg

Looks like we are going to have a nice correction, with the stochastic on a very steep downward trajectory. We see 3 big red candles that have printed, following with one small green candle right after IOST crossed a critical fib circle boundary.

I think it will bail off of this line to the down-side, providing a nice buying opportunity for the short run.

This is one of the lowest-priced DeFi projects out there, and IOST has been around ever since I first delved into crypto back in 2017.

It’s a pretty safe bet that they will be around for a while, and the DeFi move might be something we will look back on as the game changer for this token.

Carlton Flowers
The CryptoPro

NOT FINANCIAL ADVICE - Entertainment purposes only. Seek a qualified investment advisor before making any decisions on purchasing cryptocurrencies.

MY LINKS:
www.carltonzone.com/cryptopro
Telegram Group - https://t.me/cryptoprocarlton
https://www.tradingview.com/u/carltonzone/

GNT 4-Hour TA - Golem Set To Rise to Next Level?

GNT GOLEM POISED FOR A MOVE

I am going to be doing a LOT more TA on Golem. This is a gem of a project which trades on CoinbasePro. The technical analysis chart is provided from the TradingView.com website.

GNT 9-2-2020.jpg

I'm in the "buy" zone right now, ready to start accumulating. I have been on the fence since the 0.04 level, but I don't think it will drop back that low again. It just dipped below the 50-day EMA, and I'm watching closely to see if it holds this line as a base.

The stochastic is already deep in oversold territory, but the fast line is still below the slow line. It should cross over soon, and that could spark the next move up. It could also languish down in this zone IF the price line stays below the 50-day EMA.

The volume is low, but relative to prior trades, it's more than the usual. The Golem project is very impressive. Basically, it is the creation of a "supercomputer" that is comprised of several networked computers on the blockchain, and can be used to handle massive data crunching and computation without the need of investing in a supercomputer.

Fib analysis coming soon, so stay tuned!

Carlton Flowers
The CryptoPro

NOT FINANCIAL ADVICE - Entertainment purposes only. Seek a qualified investment advisor before making any decisions on purchasing cryptocurrencies.

MY LINKS:
www.carltonzone.com/cryptopro
Telegram Group - https://t.me/cryptoprocarlton
https://www.tradingview.com/u/carltonzone/

OXT 4-Hour TA

New project on the watch list! OXT is of course a high quality crypto project that is listed on CoinBase. We just watched it 5X within the last month, surging from 0.20 to ONE DOLLAR. The correctoin has brought it back down to a stable base of about 0.43.

OXT 9-2-2020.jpg

Volume is quieting down, and the stochastic is set to move up. It just dipped down well below the oversold boundary, and is on its way up. But the fast and slow lines are about to cross, which indicates another possible dip. This can pump 5X again right from where it is now. I'm adding a bag, to say the least.

OXT is a solid project based on leveraging bandwidth sharing. It’s a simple and fundamental idea that can help make internet access more efficient. Being that this project is traded on CoinBase Pro, it gets first priority for immediate trading.

Carlton Flowers
The CryptoPro

NOT FINANCIAL ADVICE - Entertainment purposes only. Seek a qualified investment advisor before making any decisions on purchasing cryptocurrencies.

MY LINKS:
www.carltonzone.com/cryptopro
Telegram Group - https://t.me/cryptoprocarlton
https://www.tradingview.com/u/carltonzone/

7-16-2019 BTC Drops Below Critical Trend Line - Is Tether "Printing" Responsible?

BULL RUN COULD BE DONE AS TREND LINE IS VIOLATED

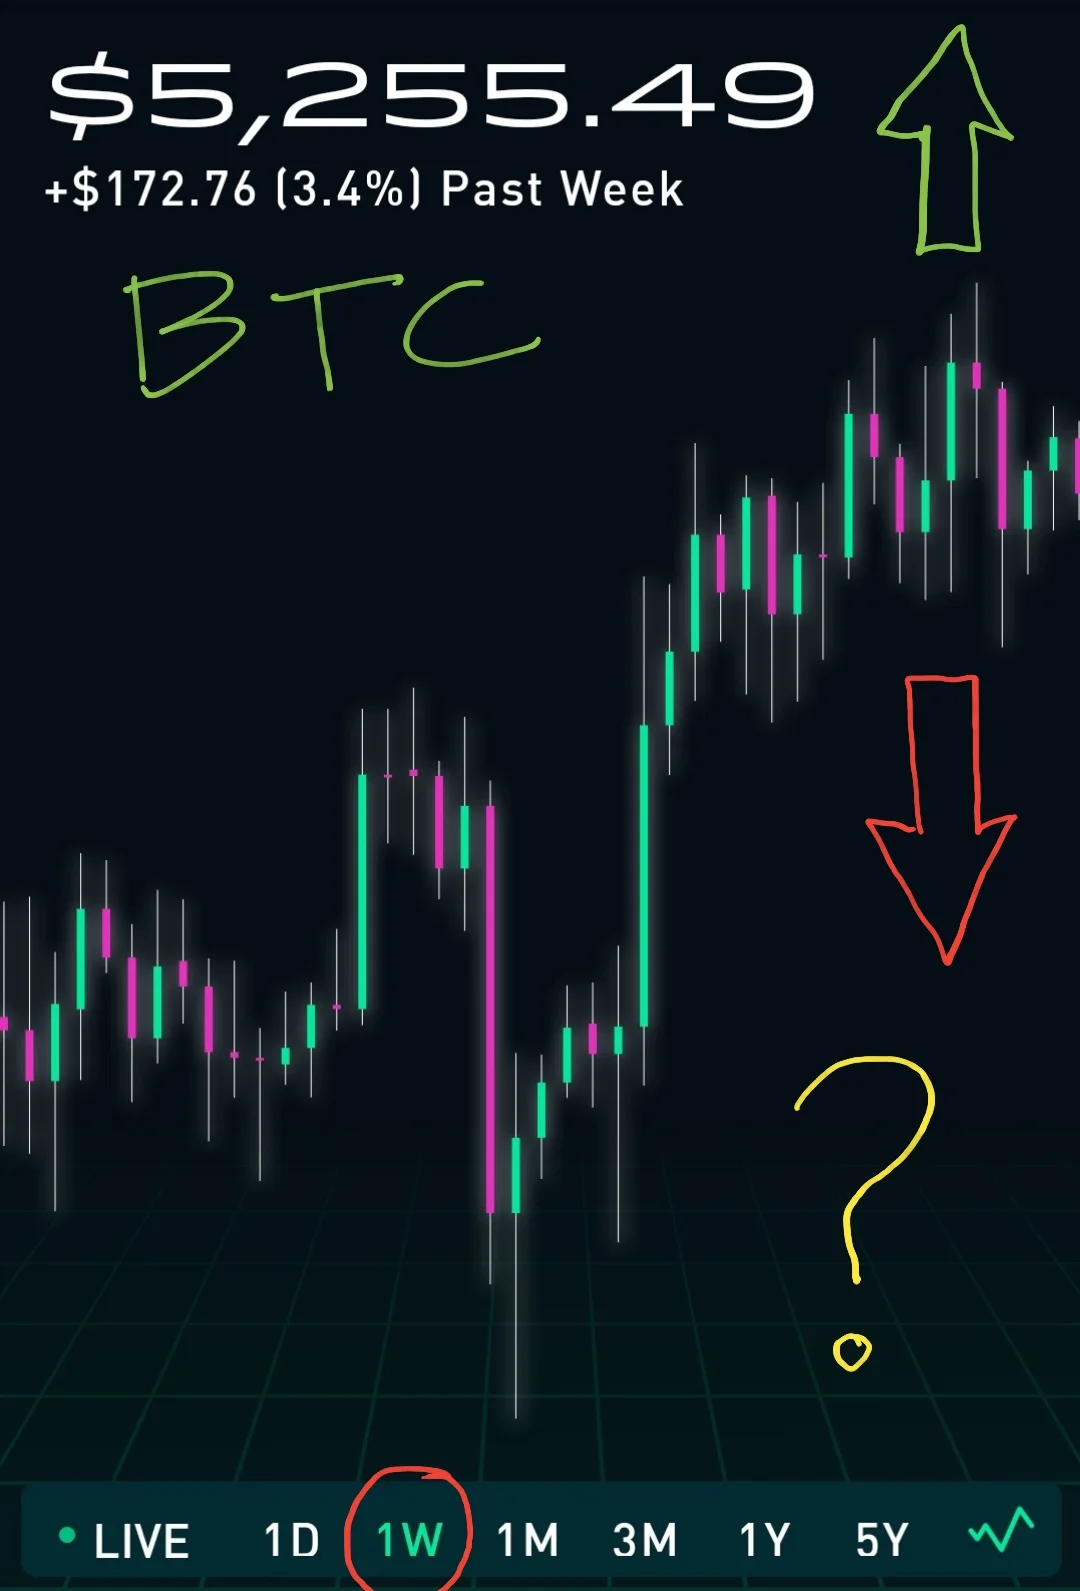
This is the most simple technical analysis we need on understanding what is going on with BTC at the moment. There is no need to go overboard with complex technical indicators when Bitcoin price action shows us something as simple and significant as this.

This move, combined with the rather “sketchy” activity of Bitfinex wildly printing Tether tokens of recent, could explain why this is happening.

First, let’s look at the critical move which could be a foretelling of the short term movement of Bitcoin price action…

When you draw a baseline from March 29th 2019 to June 9th, 2019, which by the way seems to be a popular baseline of analysis by many prognosticators of the day, we see that the Bitcoin price line has violated this base of support for the first time since this rally picked up a full head of steam.

We have already watched a major lower high form, along with 2 major lower lows, which is already an indication of possible trend reversal. I’ll be posting a more detailed analysis of these critical pivot points on the next post. But combining those facts with the current violation of the base leaves a clear indication that the short term bull run might be ending.

All hope is not lost, however. This current bull run has been highly suspect from the jump. Why? Because Bitcoin has NEVER cut short the standard market cycles over time, since its inception. The four phases of accumulation, consolidation, markup, and distribution have followed a steady trend of increasing in length of time to develop. This is a very normal and standard way that all markets develop.

But when the run to the all-time high in 2019 broke free from the standard cycle time and cut it short, I was suspicious. I truly believe that the run-up was fueled by the continuous “printing” of Tether by the Bitfinex Exchange, which continuously happened in large chunks of millions of Tether tokens.

This smacks of manipulation and conflict of interest. Why would the Securities Exchange Commission allow it to continue? We may never know. But what we do suspect is that Bitfinex does NOT hold a one-to-one backing of Tether tokens as they claimed when the token was first introduced into the market.

As per Bitfinex, the Tether token was introduced to allow faster movement in the market, providing a much-needed bridge between Bitcoin and other altcoins, to facilitate quicker settlement and movement in and out of fiat currency & cryptocurrencies. The concept was that every Tether token was backed by $1 in USD to provide liquidity, should a “run on the bank” (or the Tether token) occur.

But as time went on, the regulatory authorities and news reporting agencies suspected that the Tether token was not backed 100% by USD reserves. Now it is plainly obvious that it is not. What I believe is happening is that Bitfinex is “betting” on a small percentage of people cashing out their Tether tokens for USD after making trades.

In other words, when an individual cryptocurrency investor sells their Bitcoins, they are placing their bets on the majority of people holding on to their Tether tokens to trade them into altcoins, or wait for the price of Bitcoin to move rather than cashing out and converting the Tether into USD to be deposited back into their bank accounts.

This is the same game that banks play when they only hold a fraction of the amount of money from deposits of their customers. If you have $1 million in a bank account, the bank will leverage that deposit and lend it out many times over. It is a gamble, but as long as there isn’t a “run on the bank” (think Mary Poppins and the bank disaster), the bankers will make fortunes leveraging the deposits of others.

Each time Bitfinex printed millions of Tether tokens, they were able to gobble up BTC at higher-than-market prices, which could be why the price of Bitcoin rose so fast. But this scam would not be possible if Bitfinex were forced to show proof of the 1:1 backing of the Tether tokens if they were audited.

This is my theory of why Bitcoin price was driven up beyond the normal value, which had the result of spurring a run before the bear market cycle was completed. Now we are seeing the BTC price coming back down to Earth, heading towards the 100-day exponential moving average.

By the time this correction is done, we might be right back where we should be, completing the bear market cycle in the time frame that it should have run its course. Time will tell.

As always, this is not financial advice, and I am not a financial advisor. I am just the skeptical Cryptocurrency watchman, exposing the evidence of cracks in the foundation like Sherlock Holmes!

Until next time, let’s enjoy the action. More to come!

Carlton Flowers
The CryptoPro


6-26-2019 BTC Surge Eclipses $13,500

upload.jpg

We are at the edge of either a massive unstoppable bull run to $20,000, or capitulation within a day or 2. BTC is currently trading at $13,652.35 at the very moment I am typing this update.

I have been providing commentary via TradingView (see the links below) for the past couple of days, to share my thoughts on this historic potentially-false bull run. 

What I am watching is the $14,200 barrier. If BTC blows this barrier, there is nothing stopping it from running to $20,000 like a freight train powered by a rocket booster. 

$13,500 was the level for BTC to reach in order to clue us in on whether or not it would pivot on a key 0.618 fib circle line. But the candlesticks have become impatient, and $13,500 was breached before we could even propagate far enough to the right and reach the line. 

While writing this update, we have taken out $13,700 BTC, and I cannot even refresh the screen fast enough to see what the chart is showing.

This is the critical level that will be very telling, once the dust settles. If we do see BTC pivot at this point and start to correct, Alt season will be officially here! 

Carlton Flowers
THEE CryptoPro


6-16-2019 XRP Breakout Clues

FLAG FORMATION HINTS AT XRP BREAKOUT IN JULY

upload.jpg

I'm paying close attention to the flag formation on the ​24-hour chart. If the bullish tend holds up, this might indicate a move to the 0.60 level in a flash.

upload.jpg

Looking at the 1-month chart, we can clearly see that the downward trading channel has been broken by recent trading activity.​

On my Tradingview account, I posted an idea where another large Triangle formation is showing up. The interesting thing I noticed is that the Apex of the triangle also coincides with the 0.618 fib circle line. Doesn't seem to be a coincidence to me.​

My best guess is that XRP will experience an immediate break to the upside within a day or so, and then another major move at the Apex of the larger triangle formation.​

This could also bomb at the Apex of either of the triangles. Watch closely, and check out my Tradingview account to see the details on the fib circle coinciding with the triangle apex.​ You can check out the details on this particular scenario on my Tradingview account at https://www.tradingview.com/chart/XRPUSD/XPM455Hy-XRP-Decision-Point-at-End-of-July-2019/.

Share your thoughts! As always, this is not financial advice. Trading is risky business, seek the​ advice of a financial advisor before making any decisions.

Carlton Flowers​
TheCryptoPro​

5-27-2019 BTC Could Be Forming Smaller 2nd Bull Flag

IS THIS BULL FLAG NUMBER 2 FOR BITCOIN?

BTC 5-27-2019 2nd Bull Flag.png

It’s Monday night, Memorial Day, and if my eyes aren’t fooling me, I’m pretty sure that I am staring at a smaller, flatter bull flag formation. If this is what I think it is, we’re probably going to see a break to $9,000. What intrigues me the most is the fact that this bull run has not taken a breath since we were at the initial run to $5,000.

Just as it did in the previous bull flag formation, the baseline is holding nicely. As long as BTC does not fall below that base, my best guess is that we see another spike. They are coming hard and fast, and I would NEVER have thought this was even possible before it happened.

Bitcoin has made a fool out of me since it broke out of the doldrums and surpassed $5,000. Each and every time it surged, I expected a pullback. But the correction never came. Here again, it’s old news. BTC has broken new ground.

I think I need to write a disclaimer because I am tired of saying “this isn’t financial advice”. Heck… I don’t even know what regulatory agency is snooping on my blog site waiting for me to say the wrong thing, or not say the magical phrase. Oh well. Onward we go!

Post your predictions in the comments. Also, I’d like to know if you believe we are in an absolute bull market right now, or if you believe this is just a bull run within the bear market. Let the debate start!

Carlton Flowers
The REAL CryptoPro

5-27-2019 IOST Continuing Strong Uptrend Move

IOST RIDING TRIANGULAR MOVEMENT FOR SEVERAL DAYS

IOST 5-27-2019.png

As we approach June 1st, my eyes are on this current trend. I’ve been watching this movement for the entire month, and it’s only getting better. Will it continue through the month of June, or will IOST take a summer break?

Looking at this chart, we had a bit of a correction phase that ended on May the 23rd. Since then, the general baseline has been on the incline. If the 5-day EMA were shown on this simple chart, you would see the price action bouncing off of that line.

It’s hard to believe that the all-time high for 2019 is only 0.014, as we rapidly approach that level during this bull run. If the run continues, I look for 0.014 to be surpassed before the 1st of June. All bets are off after that point, because summertime has not been nice to the altcoin market in the past. But we shall see.

Do your due diligence, and as usual, this isn’t financial advice. Use your head. Don’t play with money you cannot afford to lose. Let me know what YOU think IOST will do in the next few days, if you have some technical analysis to share.

Now let’s have some fun and watch this thing play out in the next few days!

Carlton Flowers
The CryptoPro


Tron (TRX) Action 5-27-2019

TRX Rides A Strong Uptrend On High Volume

The brainchild of huckster Justin Sun is doing quite well this week. Tron (TRX) has poked its head above three cents and has held strong while riding some nice triangles on the way up.

I see a solid baseline on the chart, and IF this Altcoin market continues to surge, we might see Tron heading above 0.04 by the end of the week. Let’s look at the chart below:

The yellow line represents my price action prediction for the week. Of course this isn’t financial advice, and if you’re stupid enough to invest in TRX based on this slop, well, you’re gonna get what you deserve. But anyhow, that solid gradient on the baseline really looks good.

If the volume continues, and we see more of this nice MACD action above and below the line, it could get really interesting. Let’s see how close this prediction goes when we hit the end of the week. In the meantime, I’m clutching my TRX bag as tightly as I can, because I’m tempted to sell it al on this peak. But I’m going to wait until I get above my average price of 0.045. If that ever happens. LOL.

Carlton Flowers
The CryptoPro

BTC Bull Flag Confirmed, Breakout Was On-The-Money

BTC Forms Perfect Bull Flag - Breakout At Apex

Let’s look at 2 snapshots that I took over the past few days. The first was taken on May 24th, 2019 when I first notated the bull flag forming. When I took this screenshot, I figured we would have either a breakout to the positive or a dump within 3 to 5 days.

5-24-2019 BTC Flag.png

A dump would have occurred if the candles violated the lower limit of the ascending triangle, thus invalidating it. But as we see, the candles stayed true to the boundaries and allowed the price action to make it to the apex, hence the breakout.

BTC 5-27-2019 Bull Flag.png

The big question in everyone’s mind right now is, how long is this run going to last before we correct? Time will tell. My best guess is that we can plow forward to $9,000, and possibly even $11,500. But after that, I just don’t see the price holding up.

Of course BTC has made a complete fool of me for the entire month of May, with each tremendous surge after we all thought the correction HAD to come. As much as we think the correction has to take place, we get another surge. Seems like the animal refuses to be tamed.

We’ll keep our eyes on the action over the next few days, and see what happens when June 1st hits. Last year, we saw a dump as soon as the month of May was in the books. Will BTC and the Alts repeat last year’s action? Or will it surge ahead? Place your bets!

Carlton Flowers
The CryptoPro

5-26-2019 BTT Making Moves, Charting Serious Uptrend

Bit Torrent Token is On A Tear

BTT Ascention 5-26-2019.png

This is a technical analysis chart watcher’s dream. It doesn’t get any better than this. The action this past several days on Bit Torrent Token has produced one of the easiest-reading bar charts you could possibly ask for.

There are 5-straight triangular movements in a row for this bull run with the candlesticks bouncing off the 25-day moving average line, as depicted on this chart taken from Binance.

Looking at the MACD, we see a perfect oscillation from green to red as each surge and pullback cycle takes place. What I’m looking for at the end of this chart is the pullback and crossover of the MACD. When that happens, it could provide an opportunity to double-down and increase my position before the next surge.

It’s risky business, because we don’t know how long this ride is going to last. I’m just hoping we get a few more of these fantastic triangles, and I’ll try my hand at buying on the dips and selling on the peaks for a small amount of money.

With BTC surging and giving no signs of a sensible pullback, this action could continue for a few more days. Good luck if you’ve got this one, and don’t play with crypto unless you have money you’re willing to lose!

Carlton Flowers
The CryptoPro

NOT financial advise

5-10-2019 IOST Chart Looking Better Than Ever On All Levels

NO MATTER HOW YOU SLICE IT, THIS LOOKS GREAT…

IOST 1 - Year.jpg

I haven’t seen IOST chart out like this in over a year. In fact, I haven’t seen any of the alts look so good on all levels of the chart. If I had to make an educated guess, I would say that IOST is positioned quite well for the altcoin run in 2019.

I’ve been sitting on this coin since first buying a bag in 2017, before the historic BTC run to $19,000. I watched IOST spike, and fall tremendously in the bear market in 2018 and through the present time. I put IOST on the shelf, and have not thought much about it since then. But yesterday I happened to give a closer look to the price action, and this is what I observed.

For starters, let’s look at the 1-year price line. Coming down from resulting spikes during the fall from the all-time high, IOST settled into a fairly quiet period of accumulation.

IOST 2 - 3mo.jpg

The price line remained flat for better than 6 months. Then the volume spike came out of nowhere, and we wee the classic “bump” in price. This is the first clue that I look for that must precede a new bull market. Very low volume followed by a buying frenzy, bump up in price line, and a correction to levels above the accumulation base.

Moving right along, let’s zoom in closer and see what IOST looks like on the 3-month price line chart. What we see here is a definite overall trend to the positive, following the correction that came after the volume and price spike.

This is exactly what we want to see pre-bull run. If the price had corrected to a point at or below the accumulation base, I would have called this a false alarm. But there is a consistent, definite overall uptrend shown by the dashed yellow line that we can call an ascending base.

It’s even nicer to see that ending spike bouncing off of the ascending baseline. It will be a key determining factor on whether or not IOST can continue this trend. If the price line does not violate that base line, we could end up seeing a massive ascending triangle, or “pennant” formation. It’s gonna be party time if that’s what is in the cards.


IOST 3 - 1mo.jpg

Let’s zoom in even further and see what the 1-month price action shows us. For half of the month, we’ve been on that nice overall ascending trend line, ending with the bump of volume on the end of the 3-month chart that we can see a little bit closer.

Momentum up on the monthly compliments the positive momentum on the 3-month and 1-year price lines quite nicely, and you rarely ever see this.

I was so pleasantly surprised to see such a nice continuation of the evidence supporting a bullish pre-run, if that’s even a word. Some people would rather call this the “consolidation phase”, where the hike in volume comes along with a higher trading range. This chart definitely supports that assessment.

But well pound it down even closer, and see if the 7-day chart still paints a bullish trend.


IOST 4 - 7day.jpg

The 7-day price line chart is where I really start to pay attention for helping on buying and selling points. It’s really important to know if you’re at a reversal point, or still trading in an upward or downward channel before you decide to jump in and buy, or sell. Looking at the IOST 7-day chart, it’s still looking like this token is in play.

You’ve still got a clear view of that ascending baseline with a consistent trading range above it, ending on a nice note. And the volume bars coincide well with the price peaks. That’s nice.

There’s nothing worse than seeing a coin go on a run on little to no volume. That smacks of manipulation. But this chart looks like it makes sense, with the volume to price relationship.

If I wanted to buy in, or grab a few more bags of this coin, I’m looking for a swing point off the top of the recent peak with a target down on the yellow ascending baseline. Of course it’s never a guarantee for things to work out perfectly, but that’s the best way you can go about it when you’re trying to come in with the most leverage.

So let’s zoom in even further, and see how it looked for the day on the 24-hour chart, and then zone in to the 1-hour chart!

IOST 5 - 24hr.jpg

Okay, this is a gorgeous 1-day price line. Zooming in on this 24-hour view, the price action is equally impressive, bouncing along the ascending trend line. When we see a 24-hour chart like this, it makes it super easy to find a buying point. It just doesn’t get any better.

The volume bars still coincide nicely with the price peaks, and the corrections find firm support along the base line without losing ground. That’s very attractive.

Whenever you zoom in and find a sloppy chart with erratic action that doesn’t obey any trend lines, it makes it hard to settle on buying and selling points.

Taking it all the way in to the 1-hour price chart, I was shocked to see yet another beautiful work of art that would make child’s play of buying in. You’ve got a trend line that is easily depicted, and volume bars that match the surges in price. And it ends on a bullish note!

IOST 6 - 1hr.jpg

I would absolutely love it if I could find cryptos with price action charts that look like this, where it paints a clear picture all the way from the 1-year chart down to the 24-hour and even 1-hour charts. But sadly, this is a rare occurrence. I don’t know if I’ll ever even see anything like this again, so it was fun to document it for future reference.

This is what the crypto trader or HODLr has to keep their eyes peeled for when on the hunt for grabbing coins with a potentially explosive future. The charts can be very telling, and these are the patterns I watch out for.

The way I see it, you have to play it as if you could lose 100% of your money, while looking for the evidence that might give you the chance to grab something at an extremely low price that might take a moon shot in the future. That way you minimize risk, and maximize your slim chances of striking it rich.

That’s what makes crypto prospecting fun and exciting!

Carlton Flowers
The CryptoPro


4-19-2019 Is Bitcoin In a Bull Market, Or Is Correction Coming?

BTC REACHING CRITICAL DECISION POINT WITHIN A WEEK

upload.jpg

The current BTC "mini run" ​is the talk of the cryptocurrency market, and it's causing quite a frenzy. People are calling this an outright bull market and beginning of the next big run. Or is it?

I'm not one to ever believe the masses. When 90% of all prognosticators are yelling "run", human behavior and the odds will usually guarantee the opposite happening, especially when a shift from bear market to bull market hasn't been clearly determined.​

It's been a couple of weeks since the big dip and the huge pump, and BTC continues an overall steady climb. I don't have a lot of confidence that this is sustainable. I would feel a lot more comfortable if a solid consolidation took place first, rather than the obvious artificial pump that occurred 2 weeks ago.​

The huge spike move ​wreaks of "pump and dump" to me, a move by insiders or whales to lure people into a frenzy that could leave them with significant losses once the buying pressure and volume goes down.

I could be completely wrong, but this is not a time that I will be buying BTC. As the saying goes, "what goes up must come down", and I believe this applies to artificial pumps. I'm going to sit and wait it out, even if it means I miss the absolute bottom.​

Investing into crypto is super risky business, so it is best to play it safe and assume the worst. I'm waiting for the possibility of BTC correcting to $4200 before I buy. I also am fully aware that $3800 and even $2500 are possibilities for a bottom point before the next bull run hits.​

​While I don't call the current conditions a clear "bull market", I do believe that we are in the transition period, or we are close to it. So I am positioning myself for a possible repeat of November 2017 this winter.

Until then, remember that it's best not to play this market at all, and if you do, only invest what you're willing to lose. And don't take anyone's advice. Do your own due diligence!​

Carlton Flowers
CryptoPro​

4-10-2019 BTC Momentum & Correctioon Prediction

How Long Will The BTC Run Extend Before The Drop?

It’s been over a year since my last Coin Watch update, but the season is upon us, and it’s time to get back into the crypto market with fresh technical analysis! The current action on BTC prompted me to throw together this first return post, so I hope you enjoy it and chime in with your thoughts in the comments section.

After calling the BTC low of 3100, I haven’t been as lucky calling out the action since that dip. I wasn’t convinced that the bear market was over, but now I am. The current BTC move is definitely an indication that the bear market is over.

I thought we would hit a double bottom and revisit 3100 BTC or lower, but that might not happen. The massive pump and extended rise has thrown a wrench in that scenario. But while we are on this massive unprecedented run coming out of the bear market, we can guarantee that we’ll see a hard correction within the next week or two.

Let’s take a closer look at the charts, and see what we can decipher….

4-10-2019 BTC.png

It all started with the massive volume which pumped the price on that humongous green candle. Since then, we have been trading solidly along an ascending line. Now the question everyone wants to know is how long we will continue this trend before the correction comes.

It is possible that BTC could reach 6000 before correcting, but I don’t believe it will sustain itself for the time needed to reach that target. It will take around 2 weeks to hit 6000, unless we get another whale buying in that creates a massive spike.

But if we continue with what we see in this chart, I think it will reverse trend before 6000. Looking at the stochastic, we have been on the rise, as indicated by the green arrow. We’re not going to stay above the 80% line for more than a week or two without correcting. Sure, the stochastic can drop and only cause a slight drop in price, but not after staying in the “overbought” condition for an extended time period.

The next thing that draws my attention is the positioning of the candles in relation to the 5-Day exponential moving average line, and the 21-day EMA line. A bullish trend is confirmed by the faster 5-Day EMA riding high above the 21-Day line, as we see here. We typically see a peak in a short-term trend when the trading candles are floating high ABOVE the 5-Day line while it is also riding high above the 21-Day line. That gap is very telling. It’s going to close before long.

The volume spike set off the conditions that created the gap between the EMA lines, and sent the candles flying high above both. But the volume is settling down, as you can see. That’s another indication that the correction is near. Now let’s zoom in…

4-10-2019 BTC 2.png

Here we see a big divergence taking place. The stochastic is generally trending downward. The volume is settling down, trending downward. But the price is steadily climbing, and staying above the fast EMA line. That doesn’t make a lot of sense. How long can this keep up?

I’m hearing some of the expert prognosticators saying we could continue this weird little trend for 3 to 4 weeks. While that is entirely possible, I am leaning towards capitulation of this mini trend within a week and a half. I’ll be shocked if we get anything in excess of 2 more weekly green candles.

My prediction for the correction is 3800. That’s worst-case. Most people are calling for 4200. Prior trend lines and resistance levels support either of these coming to fruition. There’s no coincidence to the fact that reversals happen on old resistance/breakout levels.

Once the correction finishes, the gates will be wide open and it will be the Running of the Bulls through the end of the year. I don’t think we will return to these levels in our lifetime, barring some big major calamity or alien invasion.

I’ll keep my eyes on the indicators and report back soon. Do your due dilligence, and remember that this is not trading advice, and I am NOT a financial professional. I’m just a plain ole regular CryptoPro who happens to be better than the great majority of people.

Carlton Flowers
Bitcoin Swami


11-20-2018 BAT Basic Attention Token Approaches Target Price

BASIC ATTENTION TOKEN TARGET OF $0.10 IN RANGE

BAT 11-20-18.PNG

First of all, I love the idea behind Basic Attention Token (BAT). This is a token that will be used to reward viewers for watching advertising content. Rather than paying for traditional means of online advertising, Basic Attention Token creates a more efficient user-targeted approach that makes a lot more sense than traditional social media ads.

This is a great looking chart. It couldn’t be any better than this. We are in the midst of a good bear market, and we’ve seen 3 declining peaks since the December 2017 run. Looking at the baseline for BAT which also appears to be descending, a safe target that I may chose to jump on this crypto could be $0.10.

I think that’s as good of a guess as any. The reason being, this token has real utility. Lots of thought was put into it, and I would actually consider using it as a marketing tool. So that gives me more confidence that this token may not go to zero and fizzle out one day.

As far as the projected low, there’s no telling how far this market will go before it bottoms out. Ten cents might be the bottom. Or it could be a tenth of one cent. Nobody really knows. But judging from the previous run, I would be happy to take a gamble at ten cents and then HODL until I feel like the bull market is in full effect.

Check out the background on this one and I think you’ll like what you see. They are listed on Coinbase, which means they must have a fair amount of fundamental credibility. Coinbase is very slow to add coins, and they are making history by being one of the lucky few to be added after the Big Three.

If I pull the trigger, I will report back and track my progress. So, let’s cross our fingers and hope for a BAT MOON!

Carlton Flowers
The CryptoPro

Disclaimer - I’m not an investment advisor, so don’t follow my advice. Contact a broker for financial and investment advice. All posts made are for information and entertainment purposes only.

2-19-2018 IOST Pennant Formation - Buying Opportunity

IOST GIVING HINTS OF NEXT BREAKOUT

2-19-18 IOST.PNG

February 19th 2018 - IOST, traded on the Binance platform, has been making moves. We had a series of triangle formations forming over the past week that have been small, but stair-stepped in an upward trend that culminated with a nice breakout.

Looking at the 2-hour candlesticks, we now see a definite pennant formation that appears to be focusing in on a breakout point. The volume has been settling down since the previous breakout, which is very indicative of this coin moving to the next level.

Take special note of the volume spike during the beginning of the larger current triangle formation. The volume has settled since then, and it looks like a quiet consolidation is taking place as it settles into a new higher base at 0.05 price per coin.

The impending breakout move could push IOST back to the 0.09 support level. This is a great entry point to jump on board during what I truly believe is a bull market. The crypto market looks to be rebounding, and if this is continues, we should see several formations and lots of action for IOST.

My goal is to sell at the next peak, and then wait for the correction and consolidation to complete and then retake my position. The next move after 0.09 could possibly be 0.15. I will be looking at the charts after this next action point takes place, and we'll see if it looks like it is possible. Keep your eyes peeled!

Carlton Flowers
CryptoPro Trader Supreme

DISCLAIMER: I am not a financial advisor. Do not buy any cryptocurrency with money you cannot afford to lose. This post is for information and entertainment purposes only. Invest responsibly.


2-9-2018 XVG Pennant - Breakout?

XVG PENNANT FORMATION IS VERY TELLING

2-19-18 XVG.PNG

Watch out for XVG in the coming days. On the 1-hour candles chart, we see a sloppy pennant formation. This might not be an accurate depiction of the final flag formation, but it's close enough to know that there's a breakout on the horizon.

There's an ascending baseline when you connect the bottoms. This is called "higher lows", and is indicative of a bullish formation. There is a chance that the breakout could be in the negative, but with the overall market looking the way it is, I think this one will break out to the next level and start an entire new formation.

Watch out for the volume, and then watch for the 5-day EMA to get wild and crazy. When the 5-day EMA crosses over the 34-day, we can confirm that the breakout is the start of a new bullish channel.

Cryptocurrency Coin Watch - The Launch!

COIN WATCH MICRO BLOG - BACK IN ACTION

Coin Watch Mini Blog.jpg

Announcement! I am back into the technical analysis trading game! Back in 2013, I got back into penny stocks and started the "Stock Watcher" micro blog for trading penny stocks that were in play. But I got super busy with my businesses, and had to step away from it.

In 2017, I discovered the cryptocurrency market, and how similar it is to the OTCBB and trading penny stocks. The great thing is, just about all of the same technical indicators and chart patterns work for crytpo coins just like they did for the penny stocks.

I've decided to re-launch the mini blog and rename it to the "Coin Watch" blog. I'll be posting my trading ideas and chart updates to help those of you who trade cryptocurrencies to take advantage of this wild market.

I will still give general updates about the current state of the market over on the main crypto mini blog, but this will be for those of you who want to learn more about active trading. It goes without saying, I am NOT a financial advisor, and trading on the cryptocurrency market is EXTREMELY risky. The market is very volatile, so if you don't like wild roller coaster rides, think twice before you ever hit that "buy" button based on one of my recommendations.

Don't forget about the Crypto Resource Page with all of the links to my favorite cryptocurrency resources. I will keep that updated as time goes on.

Stay tuned and please post your comments and questions!

Carlton Flowers
CrytpoPro Supreme